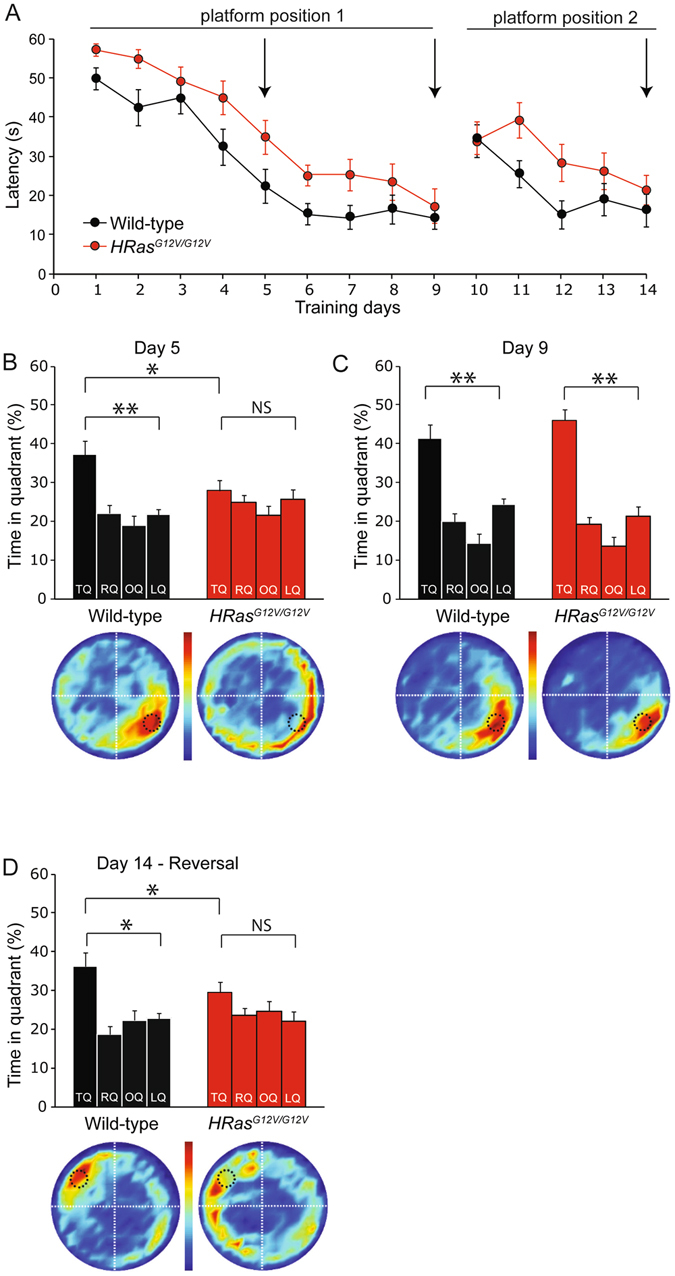
Figure 3.

Learning impairment in HRas G12V/G12V mice in the Morris water maze (MWM). (A) Average latency to find the platform for each day of training. The first 9 days represent hidden platform MWM training for the initial platform position (platform position 1). On day 10, the reversal MWM protocol was started by changing the platform position (platform position 2). A decrease in the latencies of both genotypes can be observed, however on average HRas G12V/G12V mice took significantly more time to find the platform (between subject comparison day 1–9: F 1,30 = 12.78, P < 0.01; day 10–14: F 1,15 = 6.53, P < 0.05. (B) When spatial memory was assessed in a probe trial after 5 days of training, wild-type mice preferentially searched in the target quadrant (TQ, black bar) where the submerged platform had been during the training sessions (TQ vs. other quadrants: P < 0.01), whereas HRas G12V/G12V mice did not show a preference for the target quadrant (P = 0.15); between subject comparison: effect of genotype, P < 0.05). TQ = target quadrant, RQ = adjacent right quadrant, LQ = adjacent left quadrant, OQ = opposite quadrant. (C) A probe trial after four additional days of training showed that HRas G12V/G12V mice catch up with their WT littermates (TQ vs. other quadrants: HRas G12V/G12V: P < 0.01, WT: P < 0.01; between subject comparison: effect of genotype P = 0.79). Heat plots beneath the graphs provide a visual representation of all search tracks, in which the color indicates the mean time spent at a certain position in the pool. (D) After hidden-platform training mice were re-trained in a reversal MWM task. After 5 days of training for a new platform position (day 10–14; platform position 2), wild-type mice but not HRas G12V/G12V animals showed a preference for the TQ (TQ vs. other quadrants wild-type: P < 0.01; TQ vs. OQ HRas G12V/G12V: P = 0.14; between subject comparison: effect of genotype P = 0.17). Data are presented as mean ± SEM from wild-type n = 17 mice, HRas G12V/G12V n = 15 mice (for A,B) and from wild-type n = 10 mice, HRas G12V/G12V n = 8 mice (for C). Statistical test: repeated measure one-way MANOVA, paired two-tailed t-test and one-way MANOVA. Arrows in A indicate day of probe trials.
