
Figure 3.
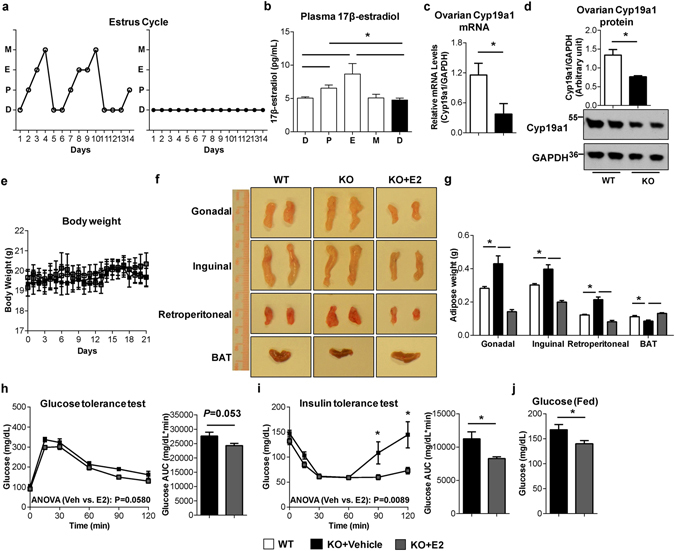
The reduction of estrogen levels contributes to abnormal fat accumulation and insulin resistance in SERT −/− female mice. (a) Representative estrous cycle stage profiles of WT and SERT −/− female mice. (b) Plasma 17β-estradiol levels of WT and SERT −/− female mice at 3-month age (n = 6 per group). (c) Cyp19a1 mRNA expression in ovary was quantified by RT-qPCR, normalized to GAPDH, and expressed relative to the control group (n = 5–6 per group). (d) Cyp19a1 protein levels in ovary were quantified by western blotting (n = 4 per group). Uncut blots are included in the Supplementary information. (e) Body weight of WT mice and SERT −/− female mice treated with placebo or 17β-estradiol for 3 weeks (n = 5–6 per group). (f and g) Representative fat tissues and weight at time of sacrifice (n = 5–6 per group). (h and i) GTT and ITT were performed on SERT −/− female mice treated with placebo or 17β-estradiol (n = 5–6 per group). The repeated measures ANOVA P value is provided. The corresponding GTT AUC and ITT AUC were calculated. (j) Fed blood glucose levels were measured (n = 5–6 per group). *P < 0.05. Values are reported as mean ± SEM.