
Figure 2.
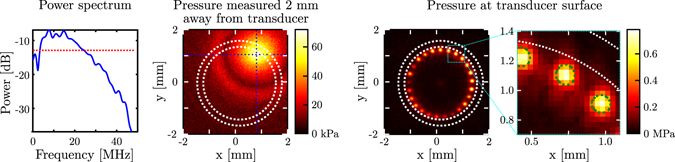
Left: Power spectrum (relative to 1 MPa) of the acoustic field transmitted by the optically absorbing coating, measured at a distance of 2 mm in front of the illuminated area. The dotted red line indicates the −6 dB level used to measure the bandwidth. Middle: Peak acoustic pressure measured across a plane placed 2 mm away from the distal fibre bundle end. The dotted blue lines indicate the location of the illuminated area on the coating; the inner and outer dotted white circles delineate the ultrasound-generating aperture and outer edge of the fiber bundle, respectively. Right: Compound image of the peak acoustic pressures, measured at the surface of the distal end of the fibre bundle, for 25 different acoustical source locations. The dotted green contours indicate, for each source position, the full-width-at-half-maximum (FWHM) of the acoustic pressure and are representative of the size of the acoustical sources.