
Figure 3.
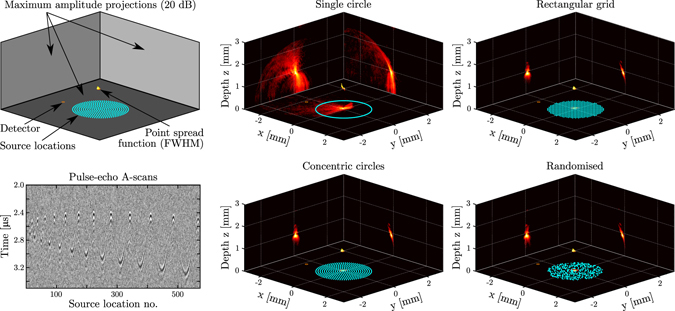
Images of the tip of a pushpin (see Fig. 4) obtained with the all-optical, three-dimensional (3D) pulse-echo ultrasound imaging system. Light was focussed sequentially into areas corresponding to each source location, and pulse-echo signals originating from each source location were recorded using an optical acoustic receiver and subsequently reconstructed into a 3D image. Top left: Schematic highlighting the information contained in the two rightmost columns. The source locations are indicated in light blue; the receiver in orange. The volumetric render shows the full-width-at-half-maximum (FWHM) isosurface that corresponds to the spatial point spread function. The three panels show the maximum amplitude projections along each spatial axis, displayed on a logarithmic scale with a 20 dB dynamic range. Bottom left: Pulse-echo A-scans recorded (using 10 averages) using a scan pattern consisting of fourteen equidistant concentric circles (573 source locations), where the circles were scanned in order of increasing radius. Middle and right columns: Imaging results for four different illumination patterns. In a clock-wise orientation: a single circle along the outer edge of the acoustical aperture (573 source locations), an equidistant rectangular grid covering the full acoustical aperture (576 source locations), a randomised pattern covering the full acoustical aperture (573 source locations), and a pattern comprising fourteen equidistant concentric circles (573 source locations).