
Figure 3.
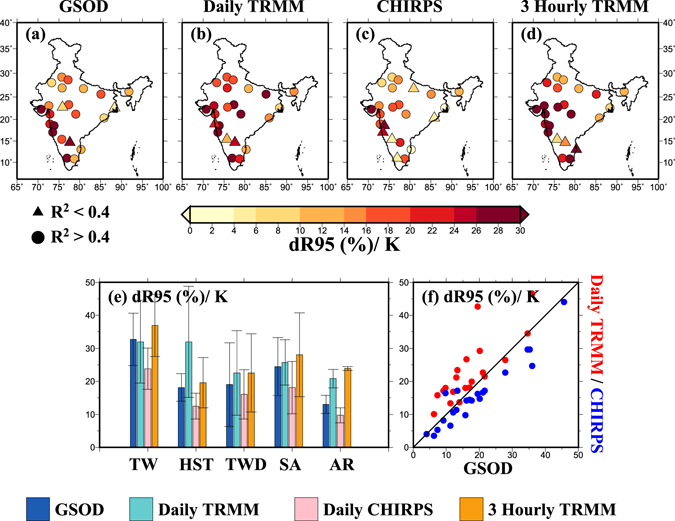
(a–d) Regression slopes (dR95/K, %) obtained from daily GSOD, daily TRMM, daily CHIRPS and 3-hourly TRMM data, respectively with dewpoint temperature (DPT) using quantile regression (QR) at the 95th percentile for 23 urban areas across India, (e) regression slopes (dR95/K) from daily GSOD (blue), daily TRMM (cyan), daily CHIRPS (pink) and 3-hourly TRMM (orange) data for different climatic zones respectively where bars denote mean values and whiskers show standard deviations, (f) agreement in scaling results between GSOD and Daily TRMM (red) and GSOD and CHIRPS (blue), pooled for all 23 urban areas. The figure was developed using the Generic Mapping Tools (GMT, https://www.soest.hawaii.edu/gmt/).