
Figure 4.
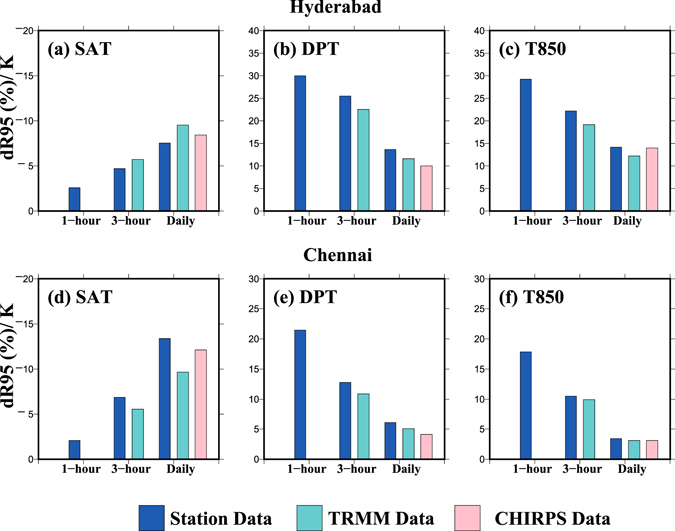
(a–c) Regression slopes (dR95/K, %) obtained using rainfall from station (blue; for 1979–2013), TRMM (cyan; for 1998–2013) and CHIRPS (pink; for 1979–2013) data with (a) SAT, (b) DPT, and (c) T850, respectively for 1-hour, 3-hour and daily durations for Hyderabad using quantile regression (QR) at the 95th percentile, (d–f) same as (a–c) but for Chennai for period 2008–2013 for all the datasets. The figure was developed using the Generic Mapping Tools (GMT, https://www.soest.hawaii.edu/gmt/).