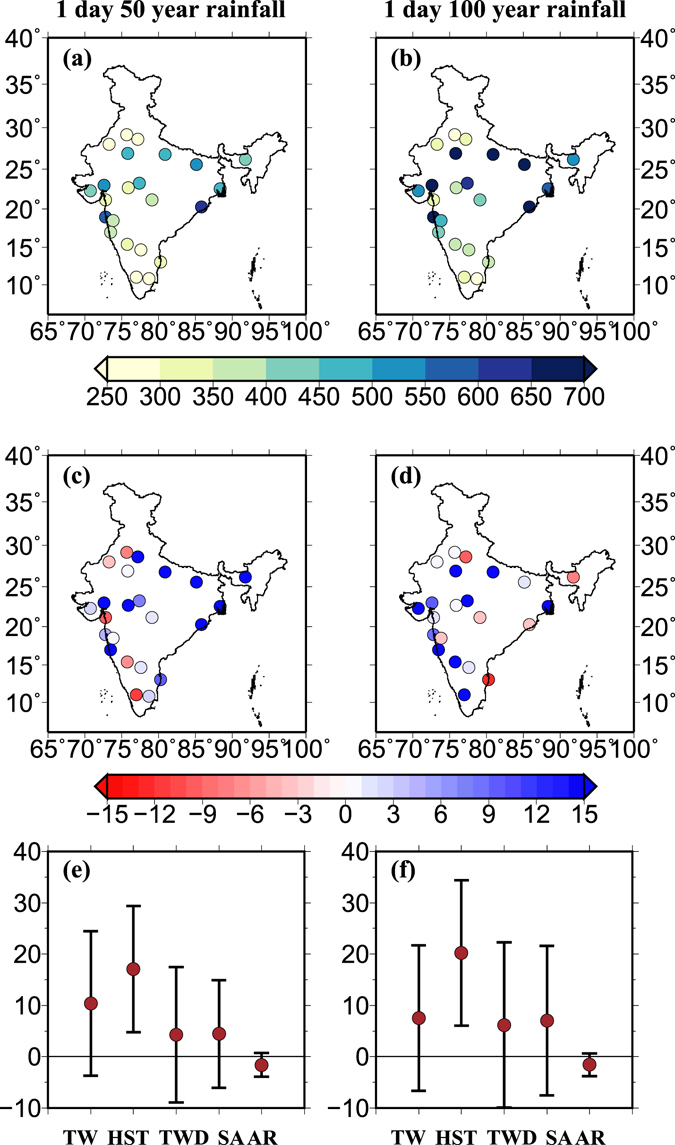
Figure 6.

(a) 1 day 50 year rainfall maxima (in mm) for 23 cities across India assuming stationary conditions, (b) same as (a) but for 1 day 100 year rainfall maxima, (c) percentage bias in 1 day 50 year rainfall maxima considering stationary and nonstationary conditions, (d) same as (c) but for 1 day 100 year, (e) same as (c) but mean and standard deviation in percentage bias for different climatic zones and (f) same as (d) but for 1 day 100 year rainfall. DPT and T850 were used as covariate to account nonstationary conditions. Percentage change in 1 day 50–100 year rainfall maxima were estimated using the stationary (S) and nonstationary (NS) conditions. Return values were estimated using ismev package in “R”. The figure was developed using the Generic Mapping Tools (GMT, https://www.soest.hawaii.edu/gmt/).
