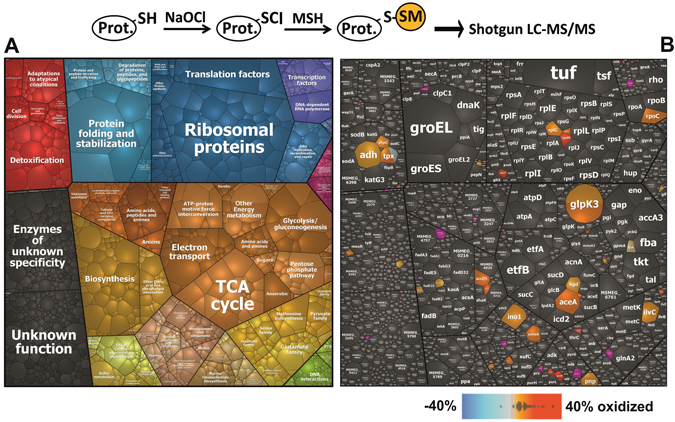
Figure 2.

Voronoi treemaps show protein abundance of S-mycothiolated proteins identified in M. smegmatis under NaOCl stress using Orbitrap LC-MS/MS analysis. (A) The treemap legend shows the classification of the M. smegmatis proteome according to TIGRfam annotations. (B) The total spectral counts determine the cell size of each protein identified in the proteome dataset and classified according to TIGRfam. The identified 58 S-mycothiolated proteins are color-coded using an orange-red color gradient based on their Cys oxidation level as quantified by the OxICAT data (Tables 2, S3 and S4). Non-modified proteins are colored in grey and S-mycothiolated proteins that were not identified using the OxICAT approach are shown in pink.
