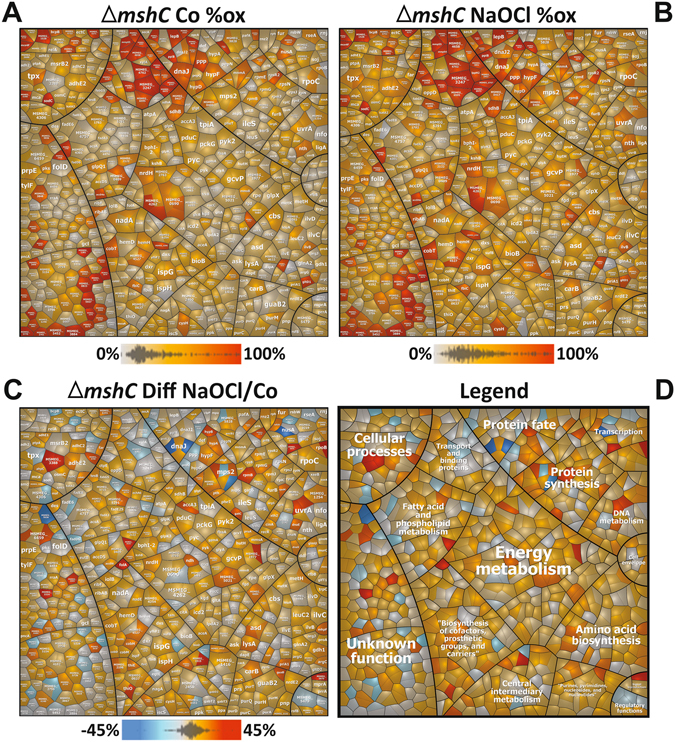
Figure 6.

Voronoi redox treemaps show the percentages of thiol-oxidation levels of all Cys-peptides identified in the redox proteome of the M. smegmatis mshC mutant. The “Voronoi redox treemaps” show the percentages of thiol-oxidations of all 823 Cys-residues identified in the mshC mutant control (A) and 30 min after exposure to 0.5 mM NaOCl stress (B) The grey-yellow-red color gradient denotes 0–100% oxidation. The Voronoi redox treemap in (C) visualizes the percentages of oxidation changes under NaOCl stress using a blue-red color gradient ranging from −60 to +60% oxidation. The treemap in (D) is used as legend for the functional classification of the proteins displayed in (C). The treemaps are generated based on the OxICAT data presented in Table S4 using the Paver software (Decodon) and proteins were classified according to the M. smegmatis TIGRfam annotation.
