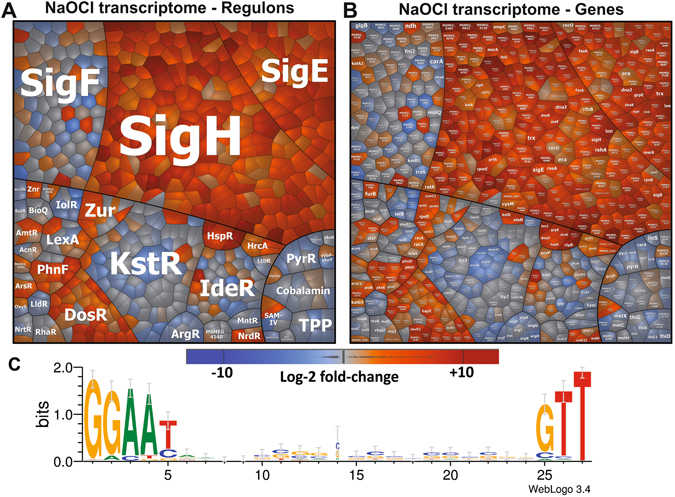
Figure 8.

The transcriptome treemap indicates the strong induction of the SigH and SigE oxidative stress regulons under NaOCl stress in M. smegmatis. (A,B) The transcriptome treemap shows changes in gene expression of the M. smegmatis wild type under 1 mM NaOCl stress as log2-fold changes (m-values). The genes are classified into operons and regulons based on the RegPrecise database (http://regprecise.lbl.gov/RegPrecise/index.jsp) and the newly defined SigH and SigE regulons of this work. The regulon classification is used as legend (A) for the gene expression treemap in (B). Differential gene expression is visualized using an orange-blue color code where orange indicates log2-fold induction and blue repression of transcription under NaOCl stress. The oxidative stress-specific SigH and SigE-regulons are most strongly up-regulated under NaOCl stress. The Web-logo of the SigH-promoter consensus sequence (C) was created using WebLogo 3.078 based on the alignment of 124 SigH-promoters identified in this work.
