Figure 1.

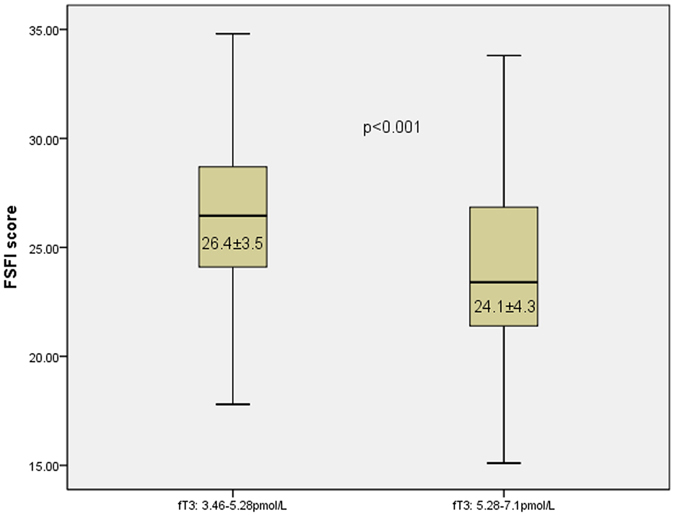
Participants were divided into two groups based on fT3 value (range: 3.46–7.1 pmol/L): 795 (3.46–5.28 pmol/L) and 324 (5.28–7.1 pmol/L). The box-plot indicates that the CVFSFI score differed significantly between the two groups, P < 0.001.

Participants were divided into two groups based on fT3 value (range: 3.46–7.1 pmol/L): 795 (3.46–5.28 pmol/L) and 324 (5.28–7.1 pmol/L). The box-plot indicates that the CVFSFI score differed significantly between the two groups, P < 0.001.