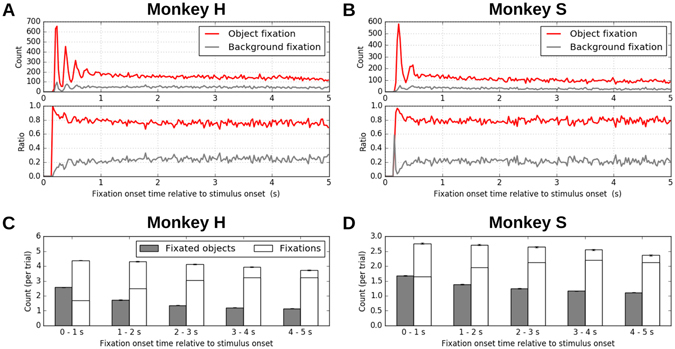
Figure 3.

Temporal development of fixation behavior. (A) Top: distribution of fixation onset times computed separately for object fixation (red) and background fixation (gray) performed by monkey H. Bin width is 25 ms. Bottom: The ratio of the count in the top panel relative to the total count of fixations in each bin. The same color convention as for the top panel applies to the bottom panel. (B) Same plot as (A), but for monkey S. (C) The number of the fixated objects (gray) and the performed fixations (white) within each of 1-second intervals during free viewing trials of monkey H. The numbers were computed for 5 successive intervals covering the whole 5 second duration of the trials, as indicated below the bars. The bar heights represent the means over trials, and the error bars indicate the standard errors of the means. The tick in a white bar indicates the number of fixations per object, i.e., the number of the fixations divided by the number of the fixated objects in the corresponding interval. (D) Same plot as (C), but for monkey S.
