
Figure 4.
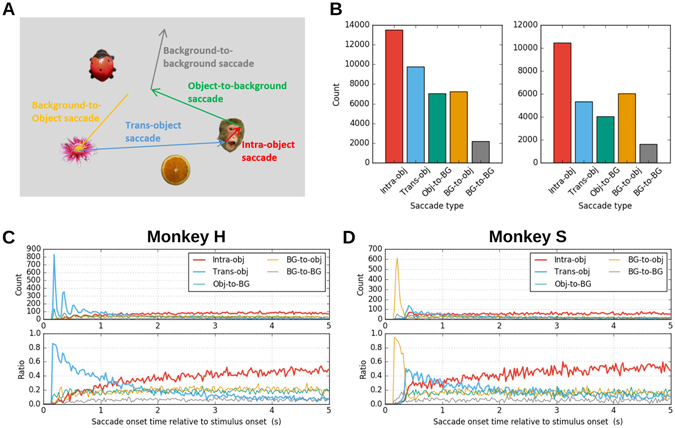
Temporal modulation of saccadic behavior. (A) Schematic illustration of saccade types. Object images are taken from the Microsoft image gallery. (B) The total number of saccades of each type. Colors correspond to them in (A). Left: monkey H. Right: monkey S. (C) Top: distribution of saccade onset times computed separately for saccades of each type (monkey H). Bin width is 25 ms. Bottom: the ratio of the counts of the top panel relative to the total number of saccades in each bin. Same color convention for both panels and as before. (D) Same plot as (C), but for monkey S. Note that the peak of the background-to-object saccade type in the beginning, which is missing in monkey H, is due to the difference in the stimulus images for the two monkeys (whether an object existed at the center of a stimulus image or not; see Methods for details).