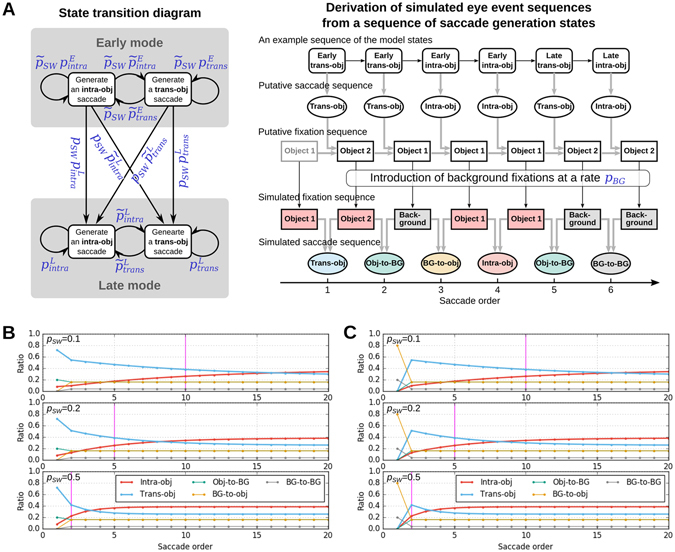
Figure 5.

A stochastic model for the eye event sequence generation during free viewing. (A) Schematic illustration of the model. Left: Markov state transition diagram. Nodes represent the states of the model, and arrows indicate possible transitions between the states, with blue symbols next to them representing the associated transition probabilities. Note that symbols with tilde represent “one minus the symbol without tilde”, e.g., . Right: Graphic representation of how the model generates simulated eye event sequences. Black and gray arrows indicate stochastic and deterministic dependences, respectively. See the main text and Methods for further details of the simulation procedure. (B) Example simulation results of saccade type ratios as functions of saccade order with different values of p SW = 0.1, 0.2, 0.5, (from top to bottom, respectively). Other parameters were fixed arbitrarily at , , and p BG = 0.2. To mimic the result of Monkey H, the first fixation was designated to be an object fixation irrespective of p BG. Magenta vertical lines indicate the expected mode-switch timing derived as the inverse of the corresponding p SW values. (C) Same plots as in (B) except that the first fixation was designated to be a background fixation in order to replicate the behavioral paradigm of monkey S (no object placed in the center of the stimulus images).
