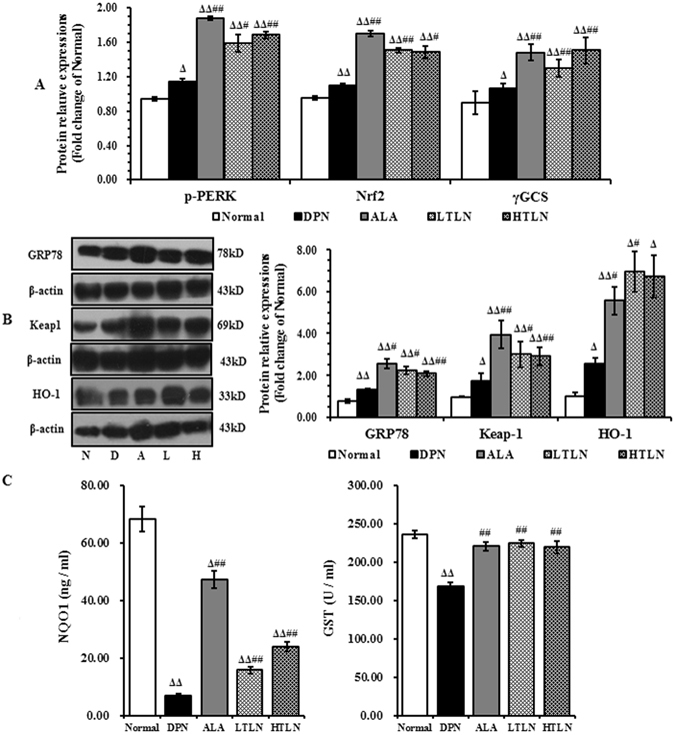
Figure 1.

Up-regulation of the PERK/Nrf2 pathway in sciatic nerve of STZ-induced DPN rats by TLN. (A) The relative expression of p-PERK, Nrf2 and γGCS determined by double-immunostaining 12 weeks after TLN treatment. (B) Representative Western blot of GRP78, Keap1 and HO-1 12 weeks after TLN treatment (Left panel), and the relative fold changes of GRP78, Keap1 and HO-1. (C) The serum levels of NQO1 and GST 12 weeks after TLN treatment. NQO1 was detected using the ELISA kit. GST activity was determined using a colorimetric method. Data are shown as mean ± S.E.M. Δ P < 0.05, ΔΔ P < 0.01 vs. Normal group; # P < 0.05, ## P < 0.01 vs. DPN group. Data were analyzed by One-way ANOVA followed by least significant difference or Tambane’s T2 analysis (n = 6 animals per group).
