
Figure 2.
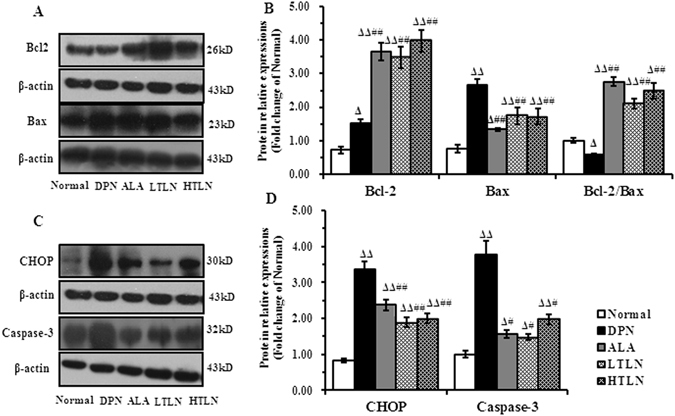
Downregulation of CHOP, Bax, Caspase-3 and upregulation of Bcl-2 in sciatic nerve of STZ-induced DPN rats by TLN treatment. (A) and (C) Representative Western blots of Bcl-2, Bax, CHOP and Caspase-3 12 weeks after TLN treatment (Left panel). (B) and (D) The relative levels of Bcl-2, Bax, CHOP and Caspase-3 (Right panel). Data are shown as mean ± S.E.M. Δ P < 0.05, ΔΔ P < 0.01 vs. Normal group; # P < 0.05, ## P < 0.01 vs. DPN group. Data were analyzed by One-way ANOVA followed by least significant difference or Tambane’s T2 analysis (n = 6 animals per group).