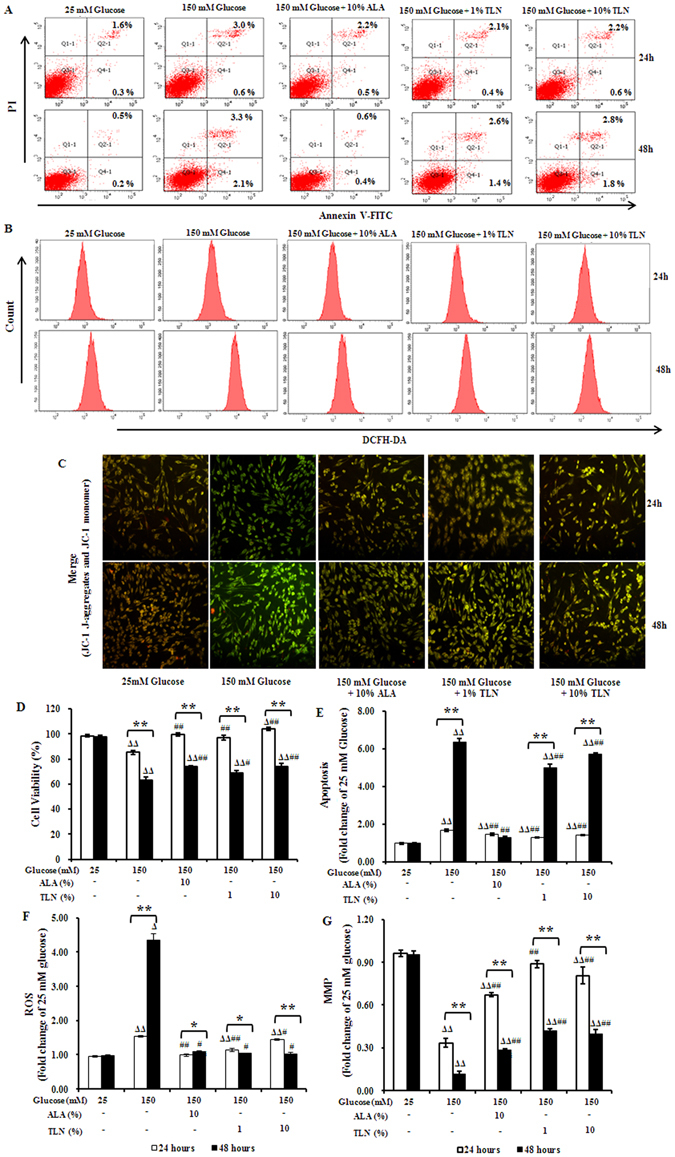
Figure 3.

Apoptosis and oxidative stress in RSC96 cells treated with TLN and exposed to high glucose. (A) FACS apoptosis assay results using FITC-Annexin V and PI staining at 24 h and 48 h. (B) Intracellular ROS production measured with FACS analysis using DCHF-DA as a fluorescent dye at 24 h and 48 h. (C) The mitochondrial membrane potential (MMP) detected using JC-1. The decrease in MMP is reflected by a decrease in red fluorescence in the merged images. (D) Cell viability determined using MTT assay. (E–G) Levels of apoptosis, MMP and ROS shown as fold changes relative to 25 mM glucose-treated cells. Data are represented as the mean ± S.E.M. Δ P < 0.05, ΔΔ P < 0.01 vs. 25 mM glucose groups; # P < 0.05, ## P < 0.01 vs. 150 mM glucose groups; * P < 0.05, ** P < 0.01 vs. treated after 24 hours. Data were analyzed by One-way ANOVA followed by least significant difference or Tambane’s T2 analysis. Student’s unpaired t-test compared to 24 hours’ time point. (n = 4 per group).
