
Figure 4.
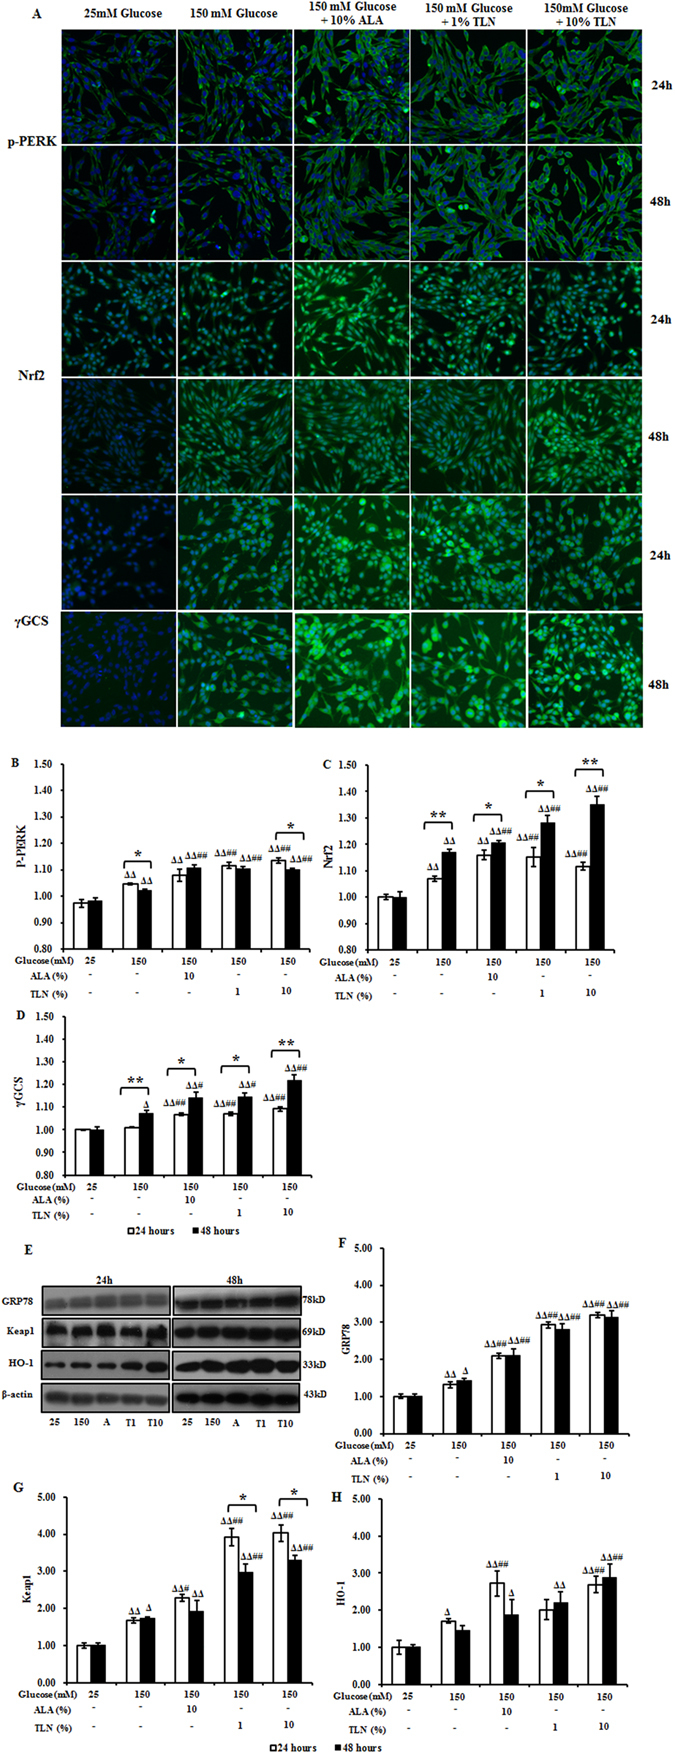
Expression of proteins in the PERK/Nrf2 pathway in RSC96 cells treated with TLN and exposed to high glucose. (A) High content analysis of p-PERK, Nrf2 and γGCS at 24 and 48 h. Images show immunostaining of RSC96 cells (10× magnification). (B–D) Fold changes of p-PERK, Nrf2 and γGCS levels relative to these after 25 mM glucose treatment. (E) Representative Western blots of GRP78, Keap1 and HO-1 in RSC96 cells 24 and 48 h. (F–H) Relative protein levels of GRP78, Keap1 and HO-1 against of β-actin. Data are represented as the means ± S.E.M. Δ P < 0.05, ΔΔ P < 0.01 vs. 25 mM glucose groups; # P < 0.05, ## P < 0.01 vs. 150 mM glucose groups; * P < 0.05, ** P < 0.01 vs. treated after 24 hours. Data were analyzed by One-way ANOVA followed by least significant difference or Tambane’s T2 analysis and Student’s unpaired t-test compared to 24 hours’ time point. (n = 4 per group).