Figure 1.

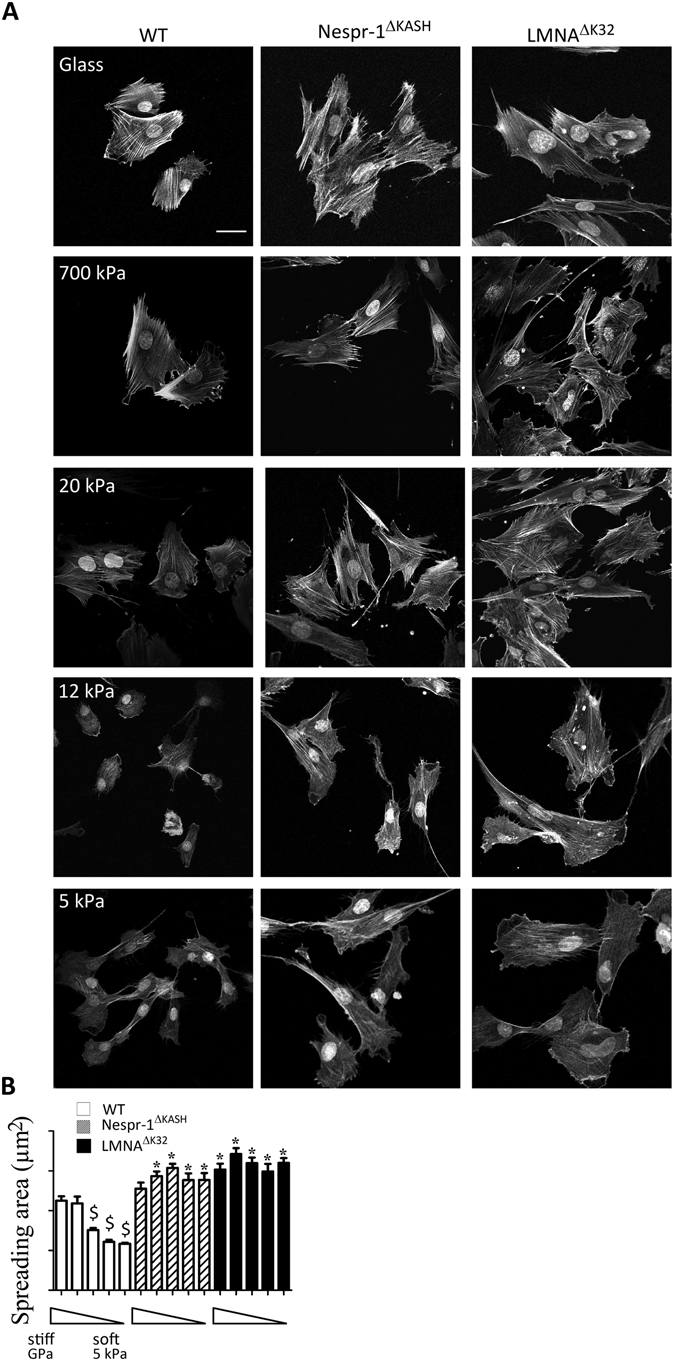
Cell responses to different substrate stiffness. (A) Phalloidin staining of the F-actin of fixed WT, Nespr-1ΔKASH and LMNAΔK32 myoblasts on fibronectin-coated glass and gel substrates of 700 kPa, 20 kPa, 12 kPa and 5 kPa. Nuclei are stained with DAPI. Scale bar: 40 µm. (B) Projected cell area as a function of substrate stiffness. Analysis was performed on glass and gel substrates of 700 kPa, 20 kPa, 12 kPa, and 5 kPa (each n > 50 cells). Values are means ± SEM; $p < 0.001 vs corresponding cell line value on glass; *p < 0.001 vs WT value at similar substrate rigidity.
