Figure 2.

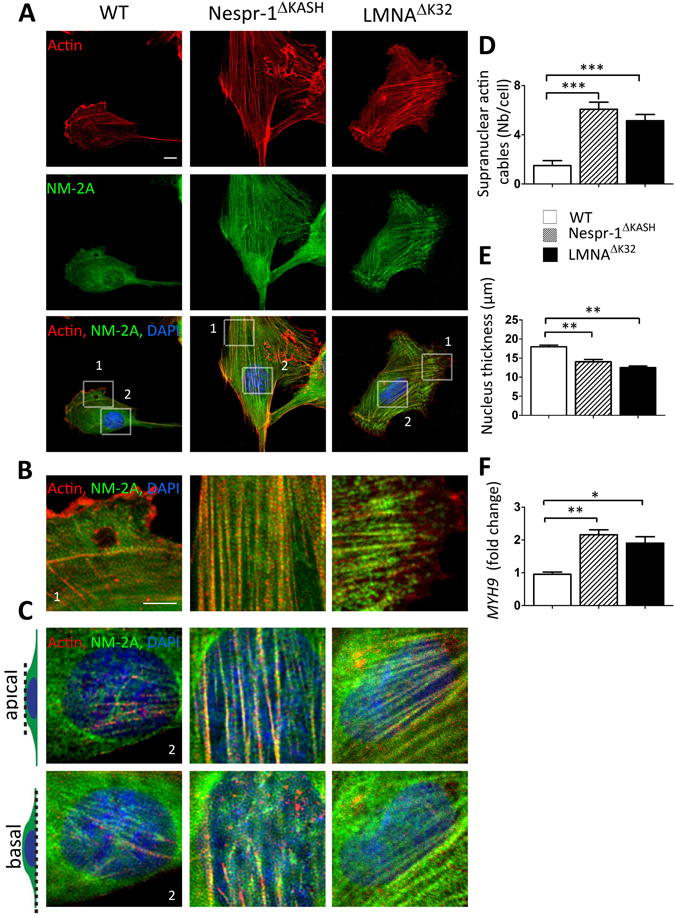
Actin cytoskeleton on soft matrix (12 kPa). (A) Confocal images of WT, Nespr-1ΔKASH and LMNAΔK32 myoblasts on soft matrix (12 kPa) close to physiological muscle stiffness and stained for F-actin (phalloidin, red) and non-muscle myosin 2 A (NM-2A, green). Nuclei are stained with DAPI (blue). Scale bar: 10 µm. (B,C) Zoom-in of actin cytoskeleton at the cell periphery (B) and in the perinuclear regions (C). In C, confocal images are taken at the apical and basal surface of the cell. Scale bar: 5 µm. (D) Supranuclear actin cable number in WT, Nespr-1ΔKASH and LMNAΔK32 myoblasts. Values are means ± SEM; ***p < 0.001 compared with WT. (E) Nuclear thickness in WT, Nespr-1ΔKASH and LMNAΔK32 myoblasts. Values are means ± SEM; **p < 0.01 compared with WT. (F) mRNA expression of MYH9 gene expression coding for NM-2A in WT, Nespr-1ΔKASH and LMNAΔK32 myoblasts. Values are means ± SEM; **p < 0.01, *p < 0.05 compared with WT.
