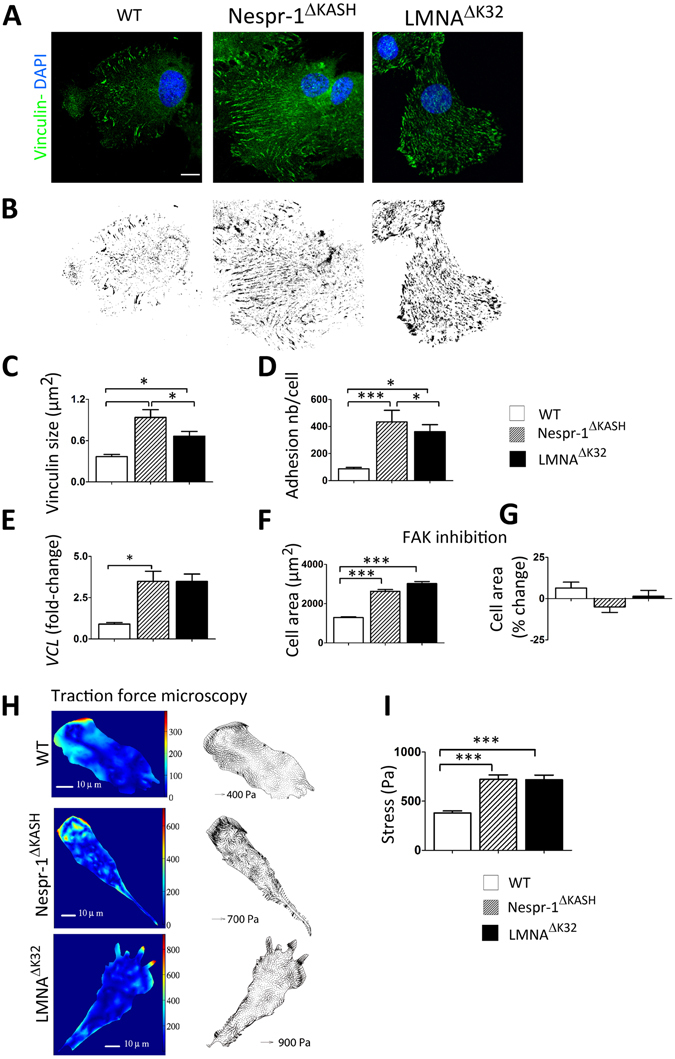
Figure 3.

Cell matrix adhesions on soft matrix (12 kPa). (A) Confocal images of WT, Nespr-1ΔKASH and LMNAΔK32 myoblasts on soft matrix (12 kPa) and stained with antibody against vinculin (green). Nuclei are stained with DAPI (blue). Scale bar: 10 µm. (B) Binary images of vinculin staining obtained from A. (C,D) Quantification of vinculin size (C) and number of focal adhesions per cell (D) in WT, Nespr-1ΔKASH and LMNAΔK32 myoblasts obtained from binary images. Values are means ± SEM in at least 12 myoblasts per line; *p < 0.05, **p < 0.01, ***p < 0.001 compared with WT. (E) Histogram of VCL mRNA expression in WT, Nespr-1ΔKASH and LMNAΔK32 myoblasts. Values are means ± SEM; *p < 0.05 compared with WT and expressed in arbitrary units (au). Values are means ± SEM, n = 5 in each cell line from 2 separate experiments. (F,G) Effects of FAK phosphorylation inhibition on cell spreading in WT, Nespr-1ΔKASH and LMNAΔK32 myoblasts. Values are expressed as µm2 (F) and as percent of baseline values for each cell line (G). At least 50 cells of each type were measured, ***p < 0.001 compared with WT. (H,I) Traction force microscopy in WT, Nespr-1ΔKASH and LMNAΔK32 myoblasts. (H) Typical images of traction isostresses (Pa) and traction stress vectors (Pa) in WT, Nespr-1ΔKASH and LMNAΔK32 myoblasts. (I) Mean values ± SEM obtained from n ≥ 9 in each cell line; ***p < 0.001 compared with WT.
