Figure 4.

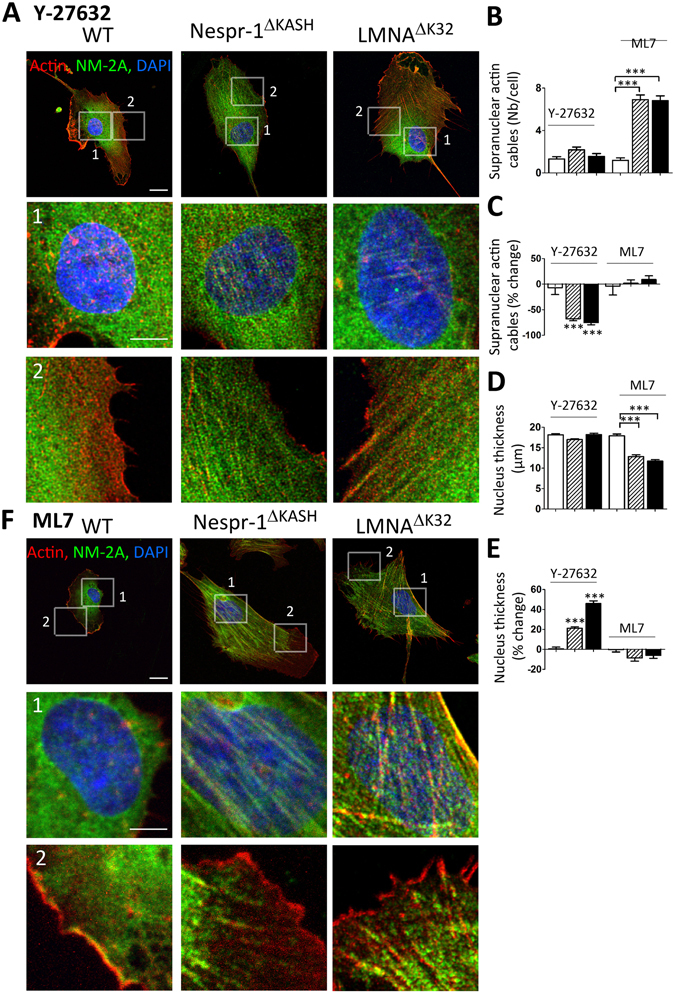
Effects of ROCK and MLCK inhibition on actin cytoskeleton in myoblasts on soft matrix (12 kPa). (A,F) Confocal images of WT, Nespr-1ΔKASH and LMNAΔK32 myoblasts on soft matrix and stained for F-actin (phalloidin, red) and NM-2A (green) after treatment with the ROCK inhibitor Y-27632 (A), and the MLCK inhibitor ML7 (F). Nuclei are stained with DAPI (blue). Scale bar: 10 µm. Images 1 and 2 show higher magnification of the perinuclear and periphery zones respectively. Zoom-in scale bar: 5 µm. (B,C) Supranuclear actin cable number in WT, Nespr-1ΔKASH and LMNAΔK32 myoblasts after treatment with Y-27632 or ML7. Values are expressed as absolute numbers (B) and as percent of baseline values for each cell line (C). (D,E) Nucleus thickness in WT, Nespr-1ΔKASH and LMNAΔK32 myoblasts after treatment with Y-27632 or ML7. Values are expressed as absolute numbers (B) and as percent of baseline values for each cell line (C). In (B–E), values are means ± SEM; ***p < 0.001 compared with WT (B,D) or compared to values before treatment (C,E). Only significant difference is figured.
