
Figure 5.
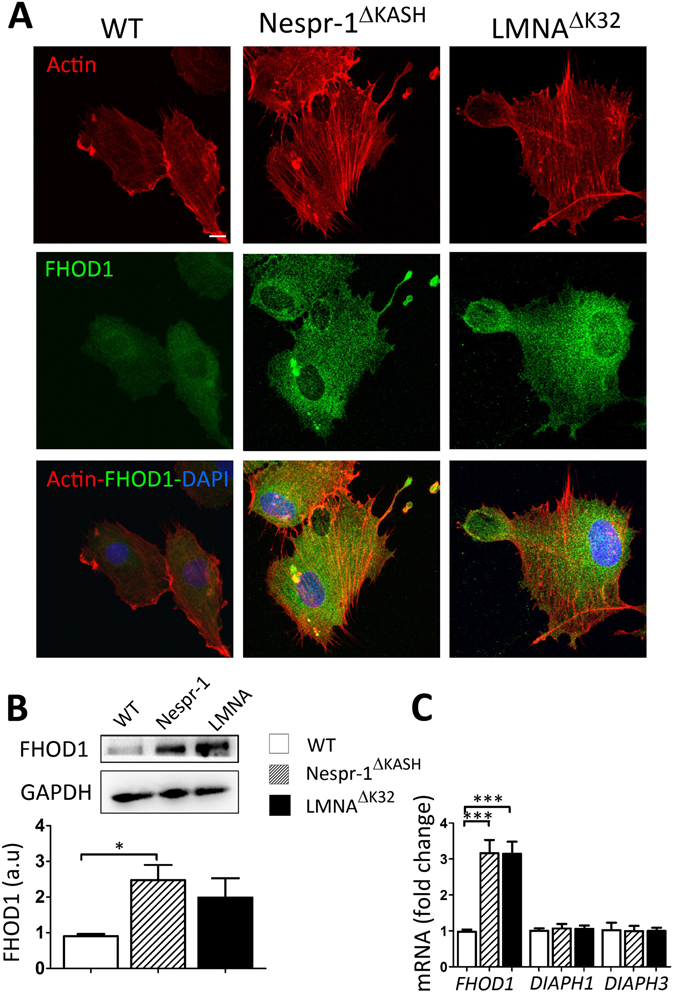
FHOD1 expression in myoblasts on soft matrix (12 kPa). (A) Confocal images of WT, Nespr-1ΔKASH and LMNAΔK32 myoblasts on soft matrix and stained for F-actin (phalloidin, red) and FHOD1 (green). Nuclei are stained with DAPI (blue). (B) Representative western-blot of FHOD1 in WT, Nespr-1ΔKASH and LMNAΔK32 myoblasts cultured on soft substrates. Histogram represents FHOD1 quantifications obtained in WT, Nespr-1ΔKASH and LMNAΔK32 myoblasts and normalized by GAPDH. Values are means ± SEM, n = 6 in WT, Nespr-1ΔKASH and LMNAΔK32 myoblasts; *p < 0.05. Only significant difference is figured; au: arbitrary units. (C) Histogram represent mRNA concentrations of FHOD1, DIAPH1 and DIAPH3 normalized to β2 microglobulin expression and expressed in arbitrary units (au). Values are means ± SEM, n = 5 in WT, Nespr-1ΔKASH and LMNAΔK32 myoblasts, ***p < 0.001 compared with WT. Only significant difference is figured.