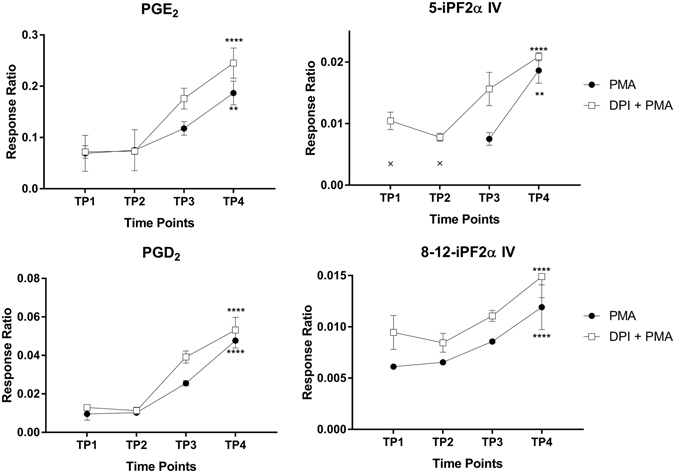
Figure 3.

HL-60 cells were treated with ATRA for 7 days, after which respiratory burst was induced with PMA in the presence or absence of DPI. Culture medium was collected at the indicated time points, and extracellular metabolites were measured. We performed intragroup ANOVA analysis over the four time points to identify significant changes in metabolite levels. Data are plotted as the mean ± SD (n = 3/group). ANOVA with **p < 0.01 and ****p < 0.0001. The data points indicated with an “x” in the top-right panel were below the metabolite’s limit of detection.
