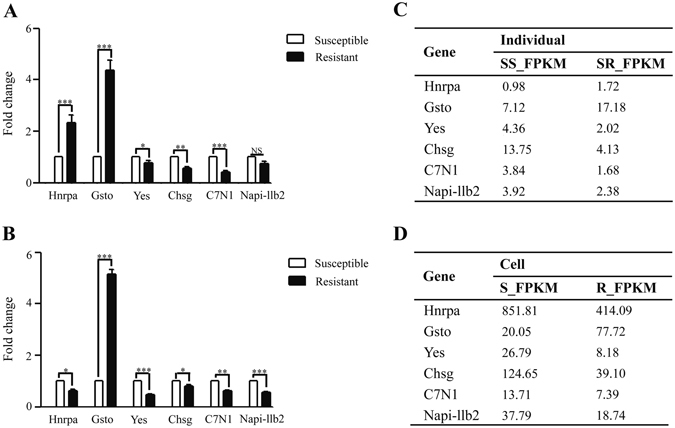
Figure 7.

mRNA expression profiles in spleen tissue and CIK cells. Transcripts of 6 genes with more than one genotype in 9 genes with confirmed SNPs were quantified in resistant and susceptible groups in spleen (A) and CIK (B) by qRT-PCR (n = 3). 18 S rRNA and EF1α as reference genes were used in individuals and cells respectively. Fold changes of mRNA expressions were relative to corresponding susceptible samples (defined as 1). *P < 0.05; **P < 0.01; ***P < 0.001; ‘NS’, not significant, P > 0.05. The normalized absolute quantification FPKM values of corresponding genes in RNA-Seq datasets of spleen and CIK were demonstrated in (C) and (D), respectively.
