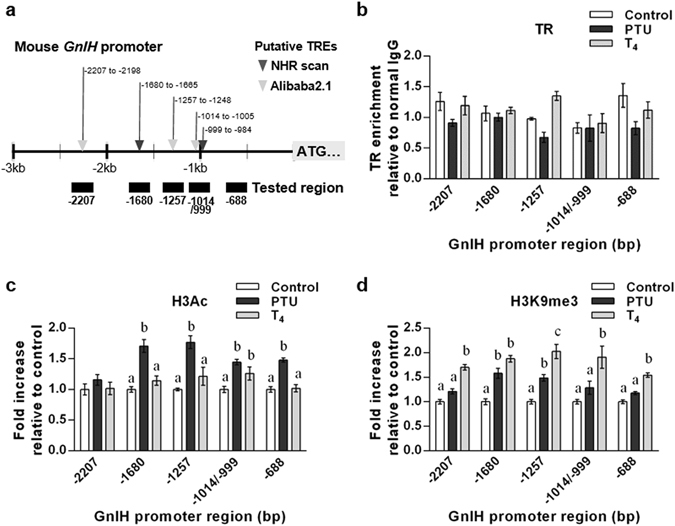
Figure 6.

Chromatin modification status of the 5’flanking region of GnIH gene in hypothyroidic and hyperthyroidic female mice. (a) Schematic diagram of the promoter region of GnIH gene. Putative TREs predicted by NHR scan (▼) and AliBaba 2.1 ( ) are indicated at their locations from ORF. (b–d) ChIP-qPCR was performed to scan TR occupancy and chromatin modifications across the GnIH promoter region. Chromatin samples from control, PTU-induced hypothyroidic or T4-induced hyperthyroidic female mice were precipitated using specific antibodies for TR (b), acetylation of histone H3 (H3Ac, (c)) and histone H3-Lysine 9 tri-methylation (H3K9me3, (d). Normal rabbit IgG was used as a negative control for the specificity of immunoprecipitation. TR occupancy in (b) is expressed as relative enrichment with normal IgG signal. Levels of histone modification in (c,d) are normalized to total histone H3 and expressed as fold increase relative to control. Data represent mean ± SEM ((b), n = 3 per group; n = 1 is 5 hypothalamic samples; (c,d) n = 6 per group). Letters indicate significant differences, p < 0.05 by two-way ANOVA Bonferroni post-test. (c) H3Ac, ANOVA summary; interaction, F
8,75 = 2.809, p = 0.0089; effect for promoter region, F
4,75 = 5.005, p = 0.0012; effect for thyroid status, F
2,75 = 52.48, p < 0.001. (d) H3K9me3, ANOVA summary; interaction, F
8,75 = 1.628, p = 0.1312; effect for promoter region, F
4,75 = 4.488, p = 0.0026; effect for thyroid status, F
2,75 = 95.46, p < 0.001.
