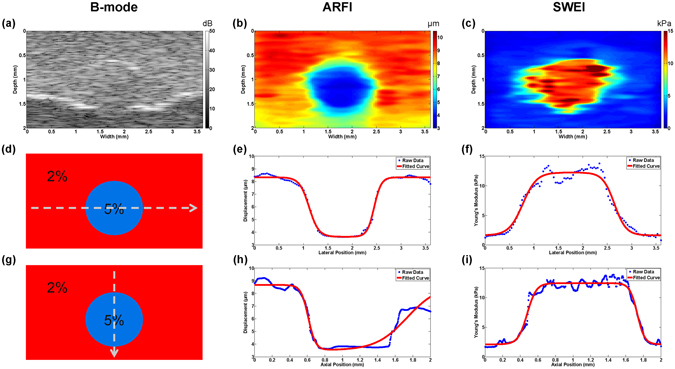
Figure 3.

Inclusion phantom imaging results and transitional curve profiles. (a–c) 2D cross-sectional B-mode image, ARFI image and SWEI image. The data profiles (d) at a depth of 1.1 mm and (g) at a width of 1.8 mm were selected. The raw data and fitted curve of ARFI and SWEI were plotted along (e,f) lateral direction, and (h,i) axial direction. The phantom has a 1.2 mm diameter cylindrical inclusion with a background-interior-background structure.
