
Figure 3.
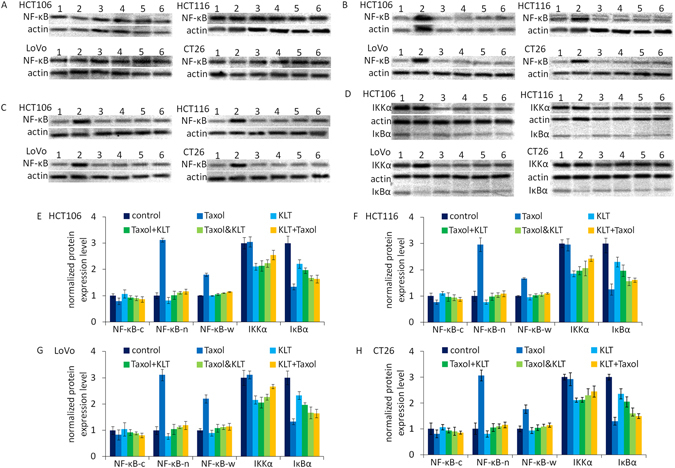
Western blotting analysis of NF-κΒ, IKKα and IκΒα expression in four colorectal cancer cell lines, HCT106, HCT116, LoVo, and CT26, which were treated with different combinations of drugs. β-Actin was used as a loading control. The numbers represent different treatment groups: 1: control; 2: Taxol; 3: KLT; 4: Taxol+KLT; 5: Taxol&KLT; and 6: KLT+Taxol. (A) NF-κΒ expression in nuclear; (B) NF-κΒ expression in cytoplasm; (C) NF-κΒ expression in whole cell lysate; (D) IKKα and IκΒα expression in cytoplasm; (E–H). The densitometric analysis bar diagram of NF-κΒ, IKKα and IκΒα expression in the four colorectal cancer cell lines. Where NF-κΒ-c represents NF-κΒ expression in cytoplasm, NF-κΒ-n represents NF-κΒ expression in nuclear, and NF-κΒ-w represents NF-κΒ expression in whole cell. (E) HCT106; (F) HCT116; (G) LoVo; (H) CT26.