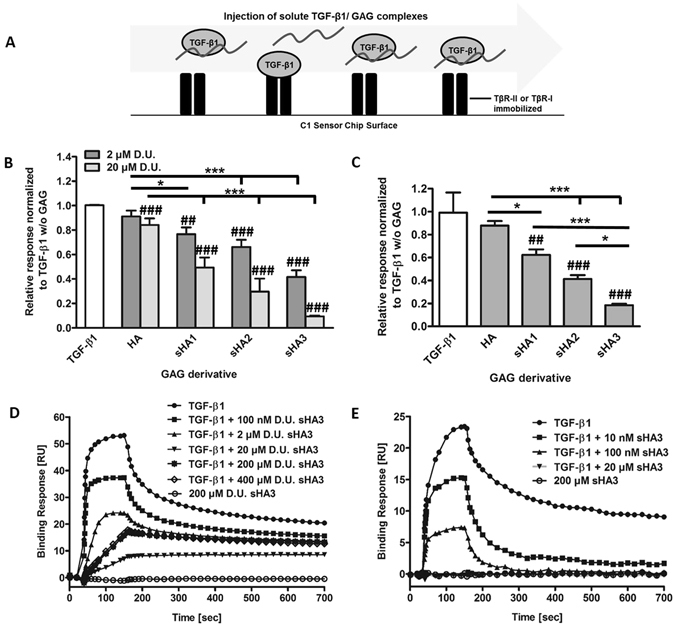
Figure 1.

Binding of TGF-β1 to immobilized TβR-II and TβR-I after pre-incubation with different GAG derivatives. (A) Schematic drawings of the experimental set-up. (B) Relative binding of 40 nM TGF-β1 to TβR-II alone and after pre-incubation with 2 and 20 µM D.U. of HA, sHA1, sHA2 as well as sHA3. (C) Relative binding of 120 nM TGF-β1 to TβR-I alone and after pre-incubation with 100 nM D.U. of HA, sHA1, sHA2 as well as sHA3. (D) Sensorgrams for the binding of 40 nM TGF-β1 to TβR-II or (E) 120 nM TGF-β1 to TβR-I alone, after pre-incubation with 0.1, 2, 20 and 200 µM D.U. of sHA3 and for 200 µM D.U. of sHA3 without TGF-β1. For (B) and (C) values represent the mean ± SD of n = 3. One-way ANOVA: *p < 0.05; ***p < 0.001 vs. HA; ##p < 0.01; ###p < 0.001 vs. TGF-β1 only. For (D) and (E) one representative sensorgram out of three measurements is shown.
