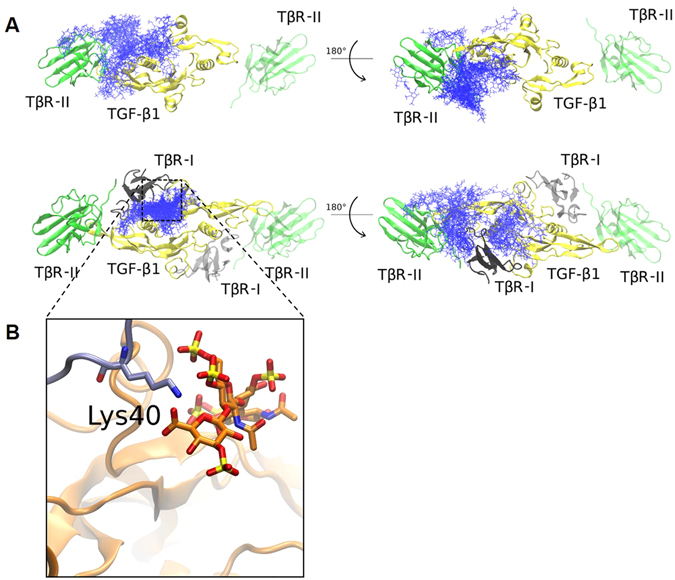
Figure 4.

Molecular Modeling of the TGF-β1/TβR-I/TβR-II/GAG System. (A) Docking results for HA463′ dp4 (top 50 solutions, in blue sticks) to TGF-β1/TβR-II (top) and TGF-β1/TβR-II/TβR-I (bottom). TGF-β1 is shown in yellow, TβR-II in green and TβR-I in grey. The part of the system not used for docking calculations (TβR-I and TβR-II on the right side of TGF-β1) is depicted with transparency. (B) Zoomed view of the residue Lys40 of TβR-I (in thick sticks, carbons in cyan) that interacts with the negatively charged groups of HA463′ dp4 (in thick sticks, carbons in orange). Protein is shown in cartoon.
