Figure 1.

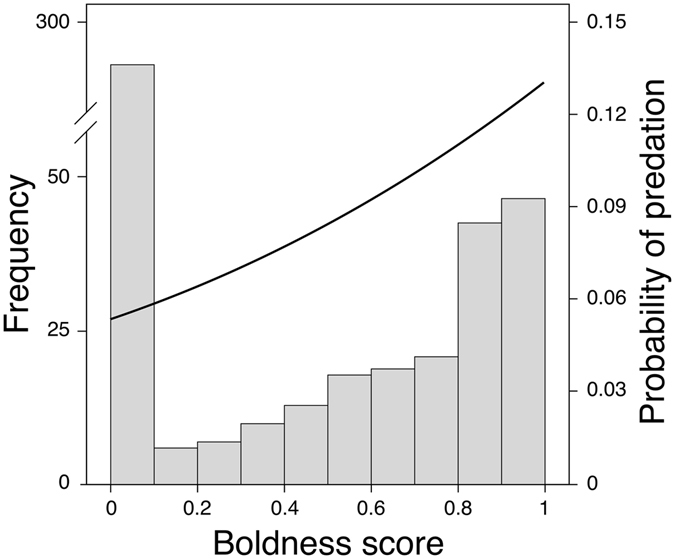
Frequency distribution (bars, left y-axis) of boldness scores overlaid with the boldness-dependent probability of cormorant predation (curve, right y-axis). Fish that had not left the refuge at 1200 s were given a boldness score of 0.

Frequency distribution (bars, left y-axis) of boldness scores overlaid with the boldness-dependent probability of cormorant predation (curve, right y-axis). Fish that had not left the refuge at 1200 s were given a boldness score of 0.