
Figure 5.
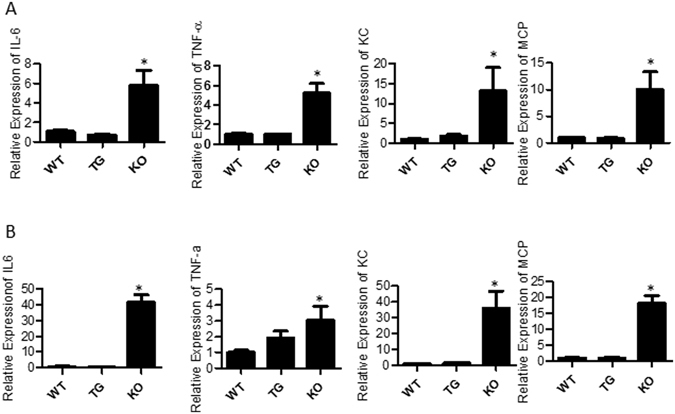
Inflammatory gene expression in kidney and heart tissue. WT, TG and KO mice were i.p injected with LPS. RNA was extracted from the cortex of the kidney and heart 16 h after LPS treatment. qRT-PCR was performed using SYBR green to detect the expression of IL-6, TNF-α, KC and MCP-1 and the housekeeping gene GAPDH was used as the internal control. Data is expressed using the ∆∆CT method and normalized to WT + LPS. (A) Kidney tissues (B) Heart tissues. n = 3–5 = ;*P ≤ 0.05.