
Figure 1.
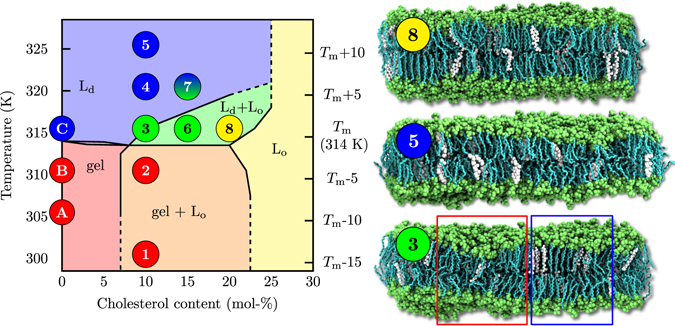
Left: Phase diagram with phase boundary lines as suggested by Vist and Davis13. Liquid–liquid coexistence is expected in the Ld + Lo regime (green). The Lo, Ld, gel and gel + Lo regions are coloured in yellow, blue, red and orange, respectively. The diagram is shifted upward by 4 K so that the main transition temperature T m agrees with that of non-deuterated DPPC. The locations of the simulated systems, also listed in Table S1, are shown by numbers (DPPC–cholesterol) and letters (pure DPPC). Their colours indicate their phases determined from our analyses. Systems 3, 6, and 7 show heterogeneous behaviour. Right: Snapshots of selected systems labelled by the points in the phase diagram: (8) Chol20316 (Lo phase), (5) Chol10326 (Ld phase), (3) Chol10316 (ordered/disordered/hexagonal), DPPC is shown in cyan and lime (chains and other parts) and cholesterol in white. Water, ions, and lipid chain hydrogens are omitted for clarity. Red and blue boxes highlight disordered and ordered regions, respectively.