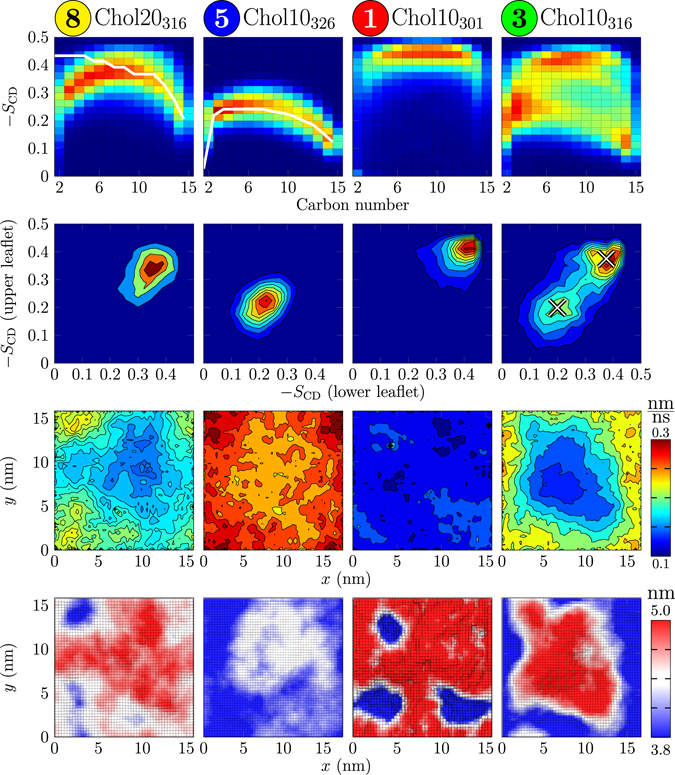
Figure 2.

Results shown for systems labelled by the points in the phase diagram (Fig. 1): (8) Chol20316 (Lo phase), (5) Chol10326 (Ld phase), (1) Chol10301 (gel), (3) Chol10316 (ordered/disordered/hexagonal). First row: Deuterium order parameter distributions along the sn-2 chain of DPPC. Available experimental data are shown in white (full line): For the Chol20316 system (8), given here are the data measured for the Lo phase (DPPC + 40 mol-% cholesterol at 308 K)51. For the Chol10326 system (5), the experimental data are for the Ld phase system (pure DPPC at 314 K)52. Second row: The spatial correlation of lipid chain order (sn-2 chain of DPPC) between the leaflets. Third row: In-plane lipid displacement map. Fourth row: Thickness maps.
