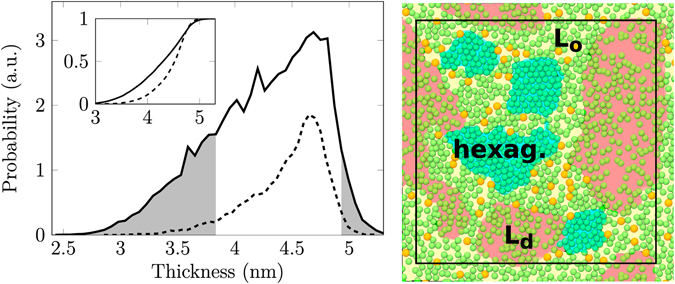
Figure 3.

Left: Thickness histogram for the Chol10316 system. The inset shows the normalized cumulative distributions. Solid lines show data collected from the whole system and dashed lines data collected from locations occupied by cholesterol. Grey fill highlights regions with a small local concentration of cholesterol. Right: The proposed domain structure; DPPC chains are shown in green and cholesterol in orange. The estimated locations of lipids displaying Lo-like, Ld-like, and hexagonally packed regions are shaded with yellow, red, and blue, respectively. The simulation box is drawn in black.
