Figure 2.

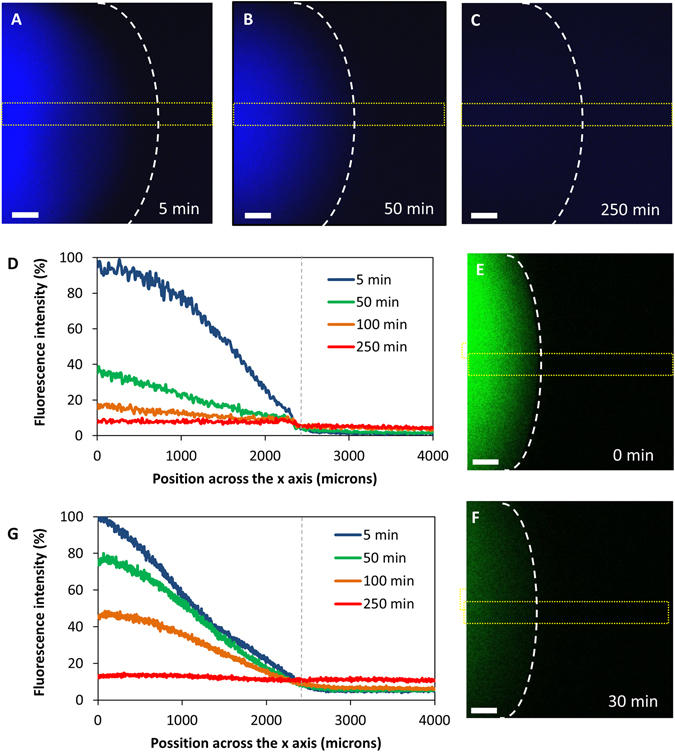
(A–C) Diffusion of Cascade Blue dextran (mean MW = 10 kDa) from an agarose spot at different time intervals time. The edge of the spot is shown by dotted white line. (D) Fluorescence intensity along a central strip of the agarose spot (shown as a dotted yellow line) at different time intervals. The edge of the spot is shown by dotted grey line. (E and F) Diffusion of Fluorescein dextran (mean MW = 40 kDa) from an agarose spot at 0 and 30 minutes time intervals. (G) Fluorescence intensity along a central strip of the agarose spot at different time intervals. The edge of the spot is shown by dotted grey line.
