
Figure 3.
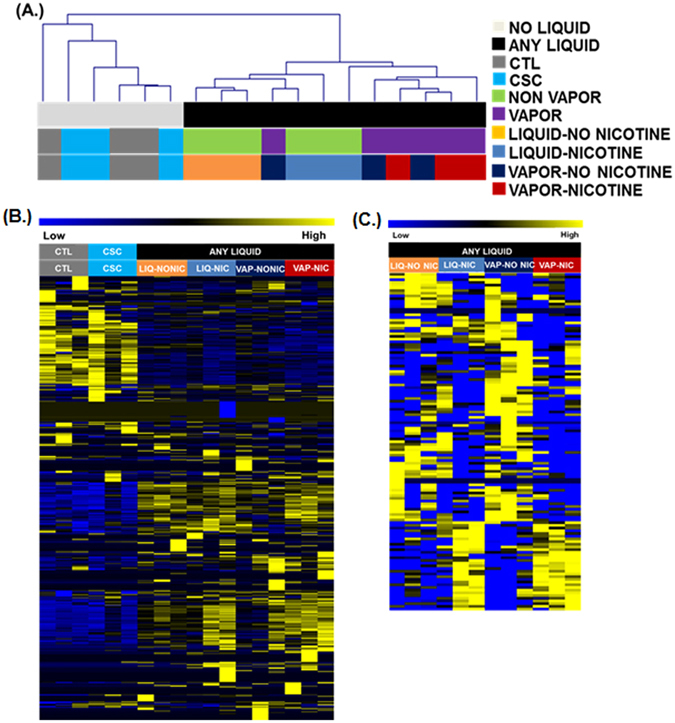
Genome-wide transcriptional analysis of microRNA expression in eCig treated NHBE. (A) Treatment with any eCig liquid has a significant effect on miRNA expression. Shown here is a dendrogram representing hierarchical clustering of samples when comparing expression of all 2541 miRNAs. The clusters were generated using Euclidean distance and average linkage clustering. Samples completely segregated based upon treatment with any eCig liquid (black bar). Individual treatment groups were untreated control (CTL), cigarette smoke condensate (CSC), non-vaporized liquid without (LIQ-NONIC) or with (LIQ-NIC) nicotine, and vaporized/condensed liquid without (VAP-NONIC) or with (VAP-NIC) nicotine. (B) SAM-Seq identified 578 miRNA significantly differentially expressed between samples with any eCig liquid treatment (n = 12), when compared to controls (n = 3). Shown are normalized expression levels for these 578 selected miRNA. Rows represent miRNA and columns represent samples. Blue indicates low expression, while yellow indicates high expression. (C) SAM-Seq identified 125 microRNA as significantly differentially expressed between cells treated with vaporized liquid (n = 6) compared to non-vaporized liquid (n = 6). Shown are normalized expression levels for these 125 selected miRNA. Rows represent miRNA and columns represent samples. Blue indicates low expression, while yellow indicates high expression.