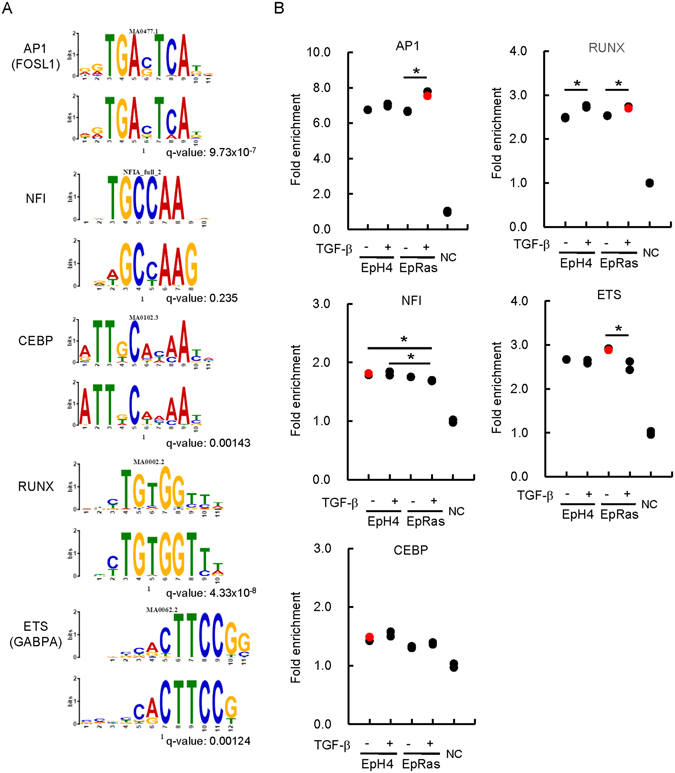
Figure 3.

Motif enrichment analysis of the context-specific FAIRE-positive regions of EpH4 and EpRas cells. (A) De novo motif prediction of accessible chromatin regions. After exclusion of promoter regions and the sequence repeat areas, 500 bp sequences flanking the middle position of each FAIRE peak region were analyzed using the Gibbs motif sampler function of CisGenome. The following parameters were used: K = 15, mean length lambda = 10 bp, and maximal length = 20 bp. Alignments to the known transcription factor binding motifs are shown as sequence logos (upper panel for each motif, most similar known motifs identified by TOMTOM; lower panel for each motif, motifs calculated from FAIRE-positive regions). q value (minimal false discovery rate required to include the motif) is shown for each motif. (B) Fold enrichment values of the identified motifs were calculated compared to two sets of matched control genomic regions picked up by Gibbs motif sampler (NC). Red dots show the datasets from which the motif was identified in (A). *p < 0.05. Note that the enrichment of every motif was significantly higher than the control genomic regions in all four samples, and the results of statistical analyses were omitted for simplicity.
