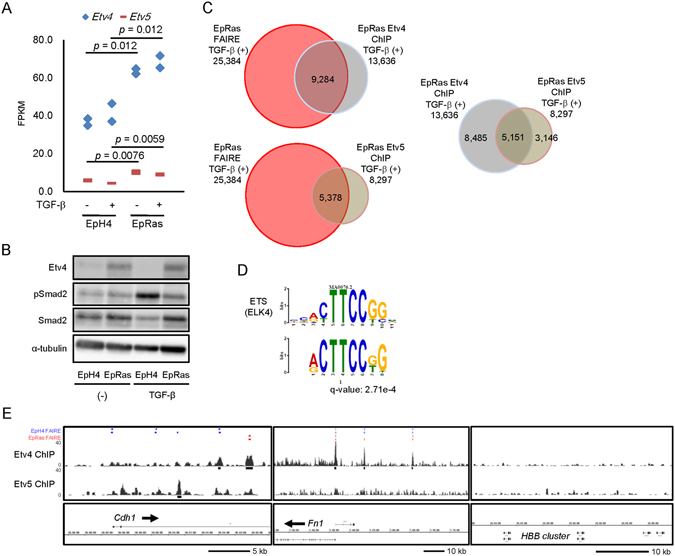
Figure 4.

Global analysis of Etv4 and Etv5 binding regions in the genome. (A) Expression of Etv4 and Etv5 by RNA-seq of EpH4 and EpRas cells treated with 1 ng/ml TGF-β for 48 h. FPKM, fragments per kilobase of exons per million mapped fragments. The experiment was performed in two biological replicates. Data are a subset of the findings shown in Supplementary Fig. S2C. (B) Immunoblot analysis of endogenous Etv4 protein expression in EpH4 and EpRas cells. pSmad2, phosphorylated Smad2. (C) Relationship between the anti-Etv4 and anti-Etv5 ChIP-seq data and FAIRE-seq data obtained from TGF-β-treated EpRas cells. (D) De novo motif prediction identifies ETS family (ELK4) binding motif, and shown as in Fig. 3A. Anti-Etv4 ChIP-seq data were used for enriched motif calculation. q value (minimal false discovery rate required to include the motif) is shown. (E) Etv4 and Etv5 binding regions at the Cdh1 and Fn1 gene loci. HBB cluster region is shown as a control. Black bars represent the significant Etv4 and Etv5 binding regions. Significant FAIRE-positive regions in EpH4 and EpRas cells, without (first row) and with (second row) TGF-β stimulation, are shown as blue and red bars, respectively, as a reference (shown in Fig. 2A).
