Figure 5.

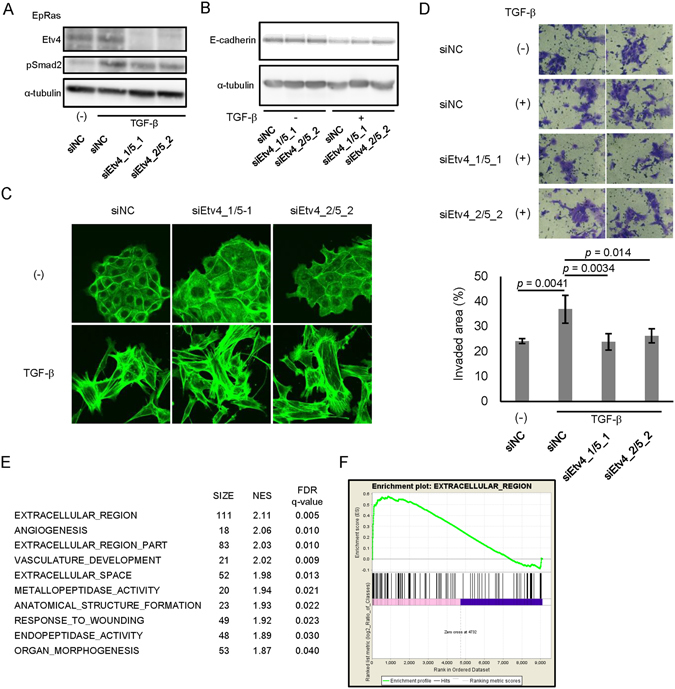
Effect of Etv4 and Etv5 siRNAs on stress fiber formation, cell invasiveness and global gene expression in EpRas cells. (A) Effect of the siRNAs on the expression of Etv4 protein. EpRas cells were transfected with the siRNAs as indicated. After 24 h of incubation, cells were treated with TGF-β for additional 48 h and lysed for immunoblotting analysis. (B) Effect of Etv4/5 siRNAs on the TGF-β-induced down-regulation of E-cadherin protein. siRNA-transfected cells were treated with TGF-β for 8 days. Transfection of siRNAs were repeated at day 2 and 5. (C) Effect of Etv4/5 siRNAs on the stress fiber formation induced by TGF-β. F-actin formation of EpRas cells was evaluated by phalloidin staining. Cells were transfected with siRNAs for Etv4/5 and stimulated with TGF-β for 48 h. (D) Matrigel invasion assay in EpRas cells. Cells were transfected with the indicated siRNAs and then seeded on the Matrigel-coated plate, incubated for 48 h with TGF-β, and fixed. (upper panels) Representative images of the cells that migrated through the Matrigel-coated membrane. (bottom graph) Quantified data representing the means of four independent experiments. Error bars, standard deviations. (E and F) EpRas cells were transfected with siRNAs for Etv4/5 and treated with 1 ng/ml TGF-β for 48 h. Then, RNA-seq and ontology analysis using GSEA were performed. Genes with maximum FPKM (fragments per kilobase of exon per million mapped sequence reads) values ≥5 among the samples were selected for evaluation. (E) A list of top-enriched c5 (gene ontology) gene sets (MSigDB) downregulated by siEtv4/5 in the absence of TGF-β. The averaged gene expression data from the two distinct sets of siEtv4/5-transfected cells were compared to the data from the siNC-transfected cells. SIZE: number of genes in the phenotype, NES: normalized enrichment score, FDR: false discovery rate. (F) An enrichment plot showing the up-regulation of a gene set “EXTRACELLULAR REGION” by Etv4 and Etv5, which was identified as the top-enriched phenotype by GSEA.
