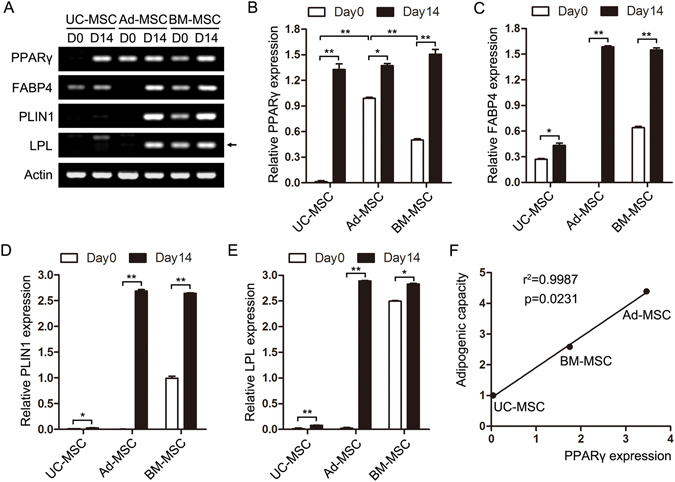
Figure 4.

Comparison of adipogenic gene expression in the three tissues-derived MSCs by RT-PCR. UC-MSC, Ad-MSC and BM-MSC were incubated with or without adipogenic medium for 14 days. (A) Adipogenic markers including PPARγ, FABP4, PLIN1 and LPL were detected at the indicated days of differentiation. Actin was used as a loading control. The picture was cropped and adjusted using photoshop software and the original image was presented in Supplementary Fig. 1. (B–E) The quantification of the four marker genes was performed using Gel-Pro software and presented. (F) The correlation of adipogenic capacity with PPARγ expression in the three sources-derived MSCs was performed using linear regression analysis. *P < 0.05 and **P < 0.01, Student’s t-test.
