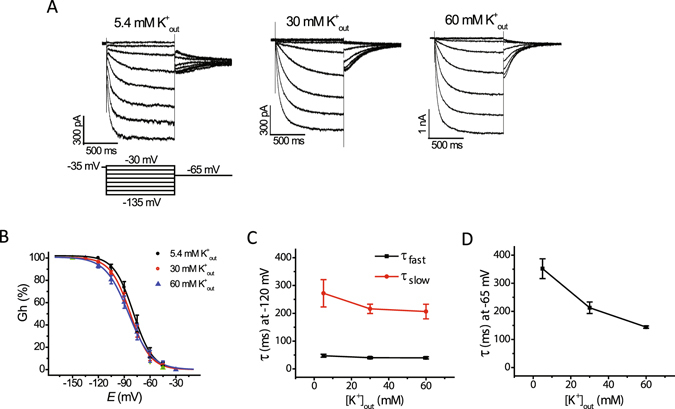
Figure 3.

Raising extracellular potassium increases the rate of Ih deactivation without significantly affecting the voltage dependence and rate of Ih activation. (A) Representative traces of Ih activated by the voltage protocol shown below the traces at 5.4 mM, 30 mM, and 60 mM potassium in the extracellular recording solution. (B) Plots of normalized tail current amplitudes at −65 mV (Gh) versus test voltage at the three concentrations of extracellular potassium. Curved lines represent fits to a Boltzmann function (cf. Material and Methods). Mid-activation voltages (V½) are −79.2 ± 3.6 mV, −82.2 ± 2.3 mV, and −84.7 ± 3.9 mV, at 5.4, 30, and 60 mM extracellular potassium, respectively, and were not significantly different (n = 7–11; ANOVA, P = 0.52). The corresponding values for slope factor (k) were 9.6 ± 0.5, 10.5 ± 0.7 and 12.4 ± 0.8, and were significantly different (n = 7–11; ANOVA, P = 0.045). (C) Plots of fast (τ fast) and slow (τ slow) time constants of activation of steady-state Ih measured at −120 mV as a function of extracellular potassium concentration. The values obtained at different potassium concentrations were not significantly different (n = 7–11; ANOVA, P = 0.42 (τ fast), P = 0.3 (τ slow)). (D) Plot of time constants of Ih deactivation as a function of the extracellular potassium concentration. The values of time constants of Ih deactivation was significantly different between values obtained at 5.4 mM, 30 mM and 60 mM extracellular potassium (n = 5–11; ANOVA, P < 0.001).
