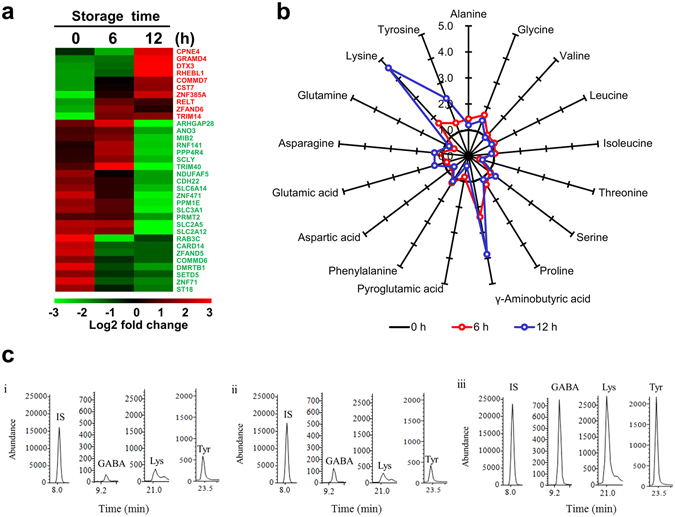
Figure 3.

Changes in transcriptome and amino acid profiles in hBM-MSCs stored in PBS for 6 and 12 h. (a) Heat map of genes with altered expression; 34 genes related to amino acid metabolism were differentially expressed at 6 and 12 h according to a microarray analysis. Red and green areas indicate up- and downregulated genes, respectively. (b) Star plot showing altered levels of 17 amino acids after 6 and 12 h of incubation in hBM-MSCs. Data are based on percentage mean composition levels of 17 amino acids after normalization to the corresponding values in the control group. Three independent experiments were performed. Selected-ion monitoring (SIM) chromatograms of GABA, lysine, and tyrosine in (i) 0 h control (ii) 6 h group (iii) 12 h group. IS, Internal standard (norvaline).
