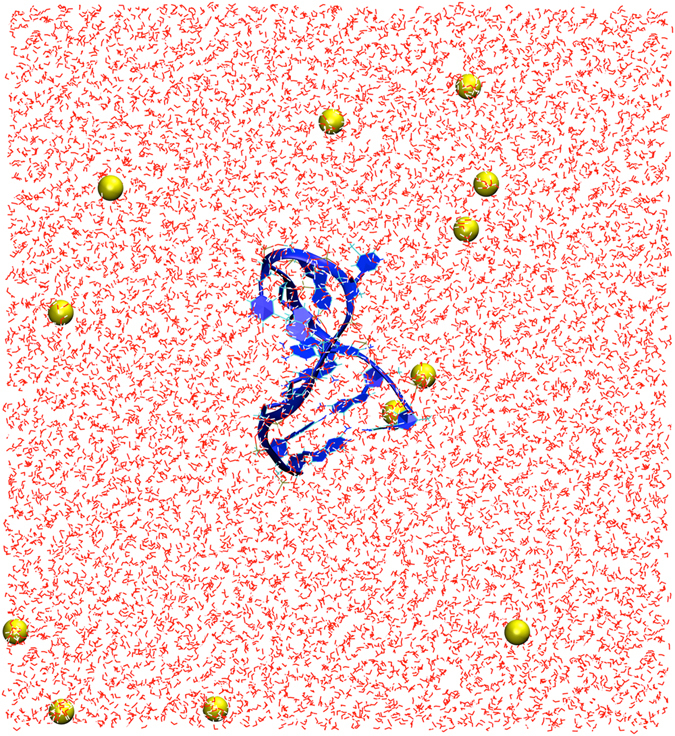
Figure 4.

Initial configuration of the MD simulation of the predicted 3D ssDNA structure for the sequence CGCGGTGTCCGCG, corresponding to 1LA8. Only the molecules within the central simulation cell are shown. The ssDNA molecule was solvated in water and the system charge neutralized with 12 sodium ions. The atoms of the water molecules are represented as white (hydrogen) and red (oxygen) lines and the sodium ions are displayed as yellow spheres with radii corresponding to its atomic van der Waals radius. The ssDNA molecule is shown in blue with the backbone and bases represented as new ribbons and the additional components represented as lines. The unit cell dimensions are L x = 72 Å, L y = 72 Å, and L z = 78 Å.
