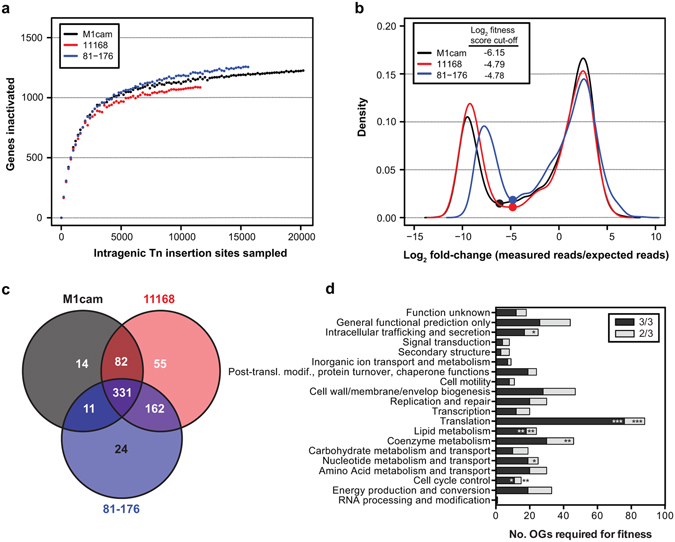
Figure 1.

Gene fitness analysis during in vitro growth of C. jejuni M1cam, 11168 and 81–176. (a) Rarefaction analysis of intragenic Tn insertions. (b) Density plot fitness score (Log2 fold-change measured reads/expected reads) per gene. Dots indicate fitness score cut-off values. (c) Overlap of homologous gene (HG) clusters (HGs) required for fitness in C. jejuni M1cam, 11168, and 81–176, representing the “pan-fitness genome”. HG clusters that are required for fitness in one or more strains are displayed. (d) Functional class (COG; Cluster of Orthologous Genes) enrichment analysis of fitness genes. Fisher exact test with Q-value multiple testing correction; *Q < 0.05, **Q < 0.01 and ***Q < 0.001.
