
Figure 5.
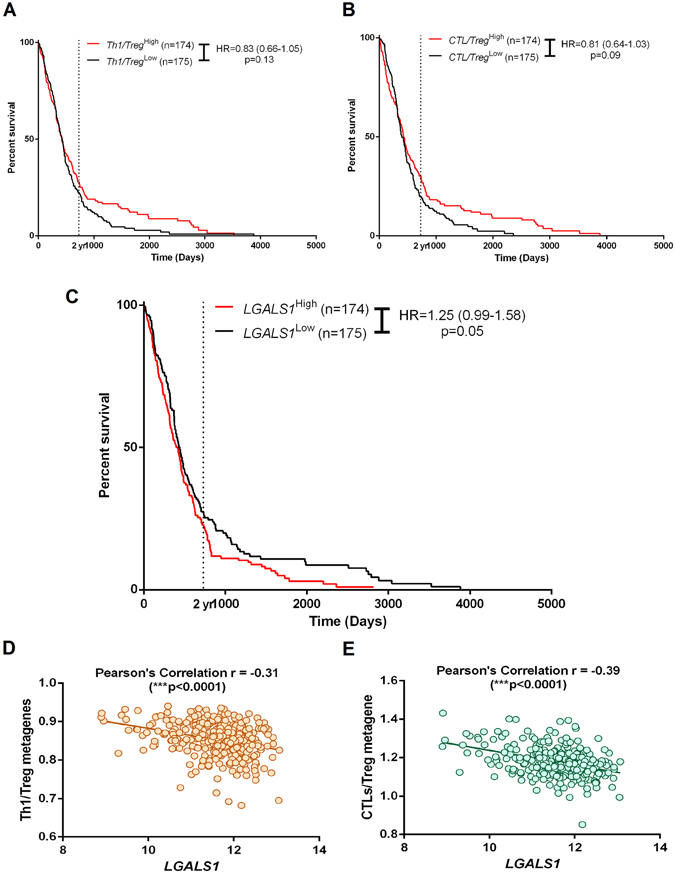
Analysis of association between T cell-associated genetic signatures and LGALS1 in human glioblastoma (GBM) patients. (A) The ratio of genetic signatures or metagenes specific for Th1 and Treg was used to stratify the The Cancer Genome Atlas (TCGA) GBM patients into “high Th1/Treg ratio” (red) or “low Th1/Treg ratio” groups; followed by Kaplan-Meier plotting of patient’s overall survival versus follow-up duration in days. (B) The ratio of genetic signatures or metagenes specific for CTLs and Treg was used to stratify the TCGA GBM patients into “high CTL/Treg ratio” (red) or “low CTL/Treg ratio” groups; followed by Kaplan-Meier plotting of patient’s overall survival versus follow-up duration in days. (C) The differential expression of LGALS1 was used to stratify the TCGA GBM patients into “high expression” (red) or “low expression” groups; followed by Kaplan-Meier plotting of patient’s overall survival versus follow-up duration in days. In A–C graphs, log-rank (Mantel-Cox) test p-values and hazard ratios (HR) with 95% confidence interval (in paranthesis) are displayed. Alternatively, a Pearson’s correlation coefficient was calculated to assess the overall association between LGALS1 expression and overall expression of either Th1/Treg ratio (D) or CTL/Treg ratio (E).