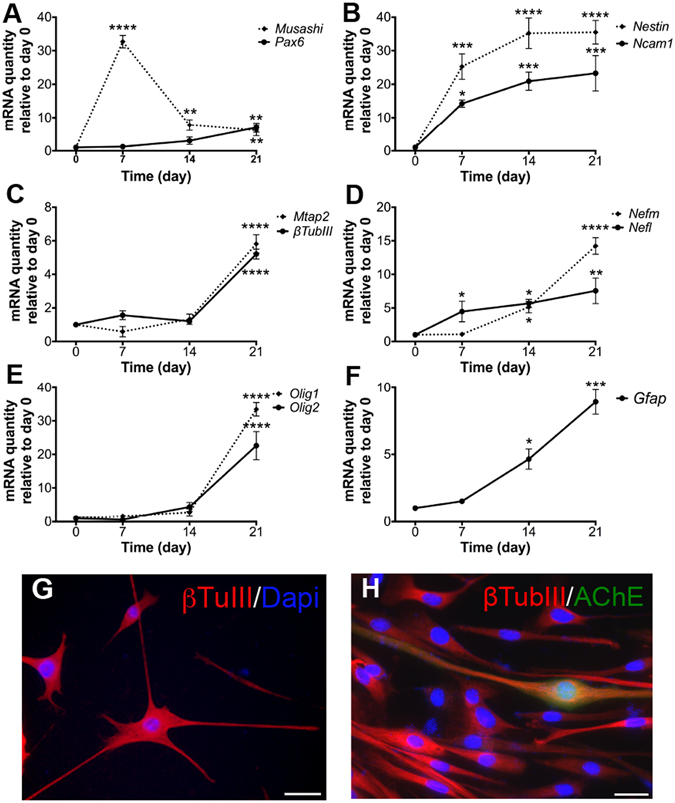
Figure 4.

Induced neuronal differentiation of iMuSCs. (A–F) Gene expression kinetics were analyzed by qPCR during the 21-day neuronal differentiation period of the plated iMuSC-formed neurospheres. Data are presented as ± SEM of five biological replicates. *P < 0.05, **P < 0.01, ***P < 0.001, ****P < 0.0001. (G,H) Immunocytochemical staining of neurons after 21-day differentiation from iMuSC-formed neurospheres. β-Tubulin III (red, G,H) and AChE (green, H). Nuclei were stained with DAPI. Scale bar = 100 µm (G) and 10 µm (H).
