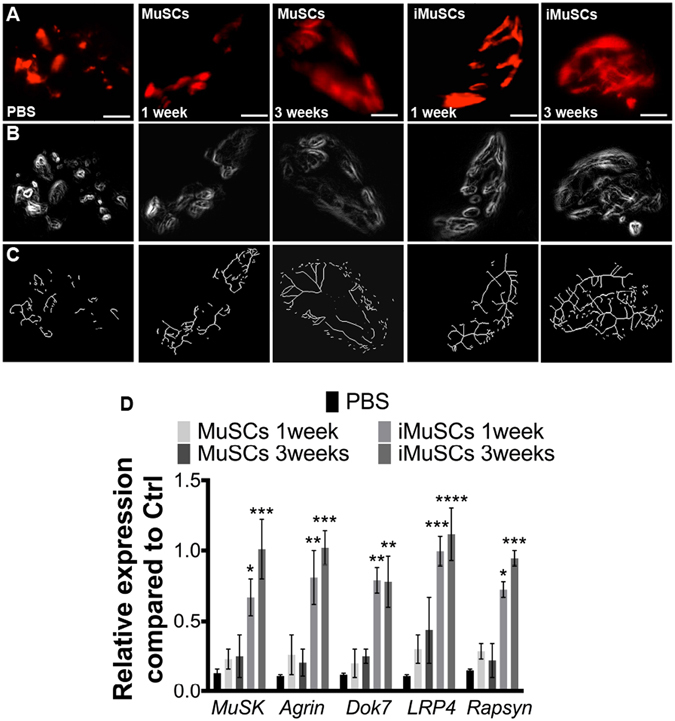
Figure 6.

NMJ recovery after transplantion of iMuSCs into mdx mice. (A) Representative IF images of NMJs after treatment of GMs with no cells, MuSCs, and iMuSCs in mdx mice (red, A). (B) Processed binary images and (C) skeletonized images show discontinuity and branching patters. (D) Expression of MuSK complex constituents. Data are presented as mean ± SEM of five biological replicates. *P < 0.05, **P < 0.01, ***P < 0.001, ****P < 0.0001.
