
Figure 1.
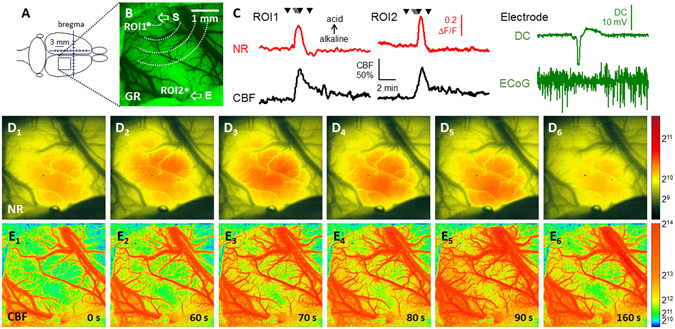
Representative raw image sequences and graphs illustrate synchronous changes in Neutral Red (NR) fluorescence, cerebral blood flow (CBF), direct current (DC) potential and the electrocorticogram (ECoG) with the propagation of a spreading depolarization (SD) wave in the intact cerebral cortex of a young rat. (A) Position of the closed cranial window over the parietal cortex. (B) The cortical surface at green light illumination. Two regions of interest (ROI) indicate the origin of NR and CBF traces shown in Panel C. The tip of the capillary used to trigger SD (S), and the penetration site of the glass capillary electrode (E) inserted to acquire electrophysiological signals are shown with arrows. (C) Traces demonstrate SD-related relative changes in NR fluorescence (red) and CBF (black). The occurrence of SD was confirmed by the negative shift of the DC potential and the transient depression of the ECoG (green). Small black triangles pointing down over the NR traces designate the origin of the representative images shown in Panels D,E. (D) Pseudo-colored images of NR fluorescence demonstrate a propagating increase of fluorescence intensity associated with SD; the original images relying on a 16-bit grayscale. A scale bar to the right represents the used color range. (E), Pseudo-colored perfusion maps based on laser speckle contrast images (in 16-bit resolution) show the CBF response with SD, and display speckle contrast perfusion units. Warmer colors represent higher CBF. A scale bar to the right represents the used ranges of gray levels.