
Figure 10.
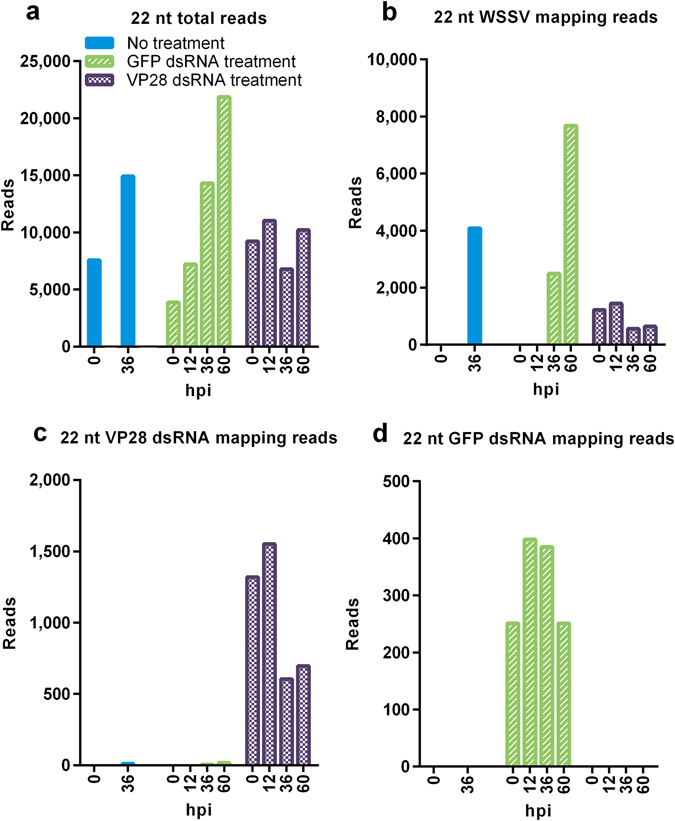
Mapping rate of 22 nt long siRNAs during WSSV infection. RNA was isolated from stomach tissue and equal amounts were pooled for each sample within a given group at a given time point. RNA sequencing was performed on these pools and 22 nt long reads were filtered out to be analyzed separately. (a) Represents 22 nt reads frequency among all available reads from each sample, (b) represents 22 nt reads frequency among reads mapping to a WSSV reference genome, (c) represents 22 nt reads frequency among reads mapping to the VP28 dsRNA treatment sequence, and (d) represents the 22 nt reads frequency among reads mapping to the GFP dsRNA sequence. The Y-axis represents reads per million total reads for a given sample (RPM).